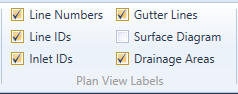
Stormwater Studio offers a variety of options for labeling your plan view. These options are accessed from the Ribbon Menu.
Plan View Label Options
The following options are mostly self explanatory. Try experimenting by simply checking On/Off the various options to see the effects they have on your Plan.
Show Drainage Areas
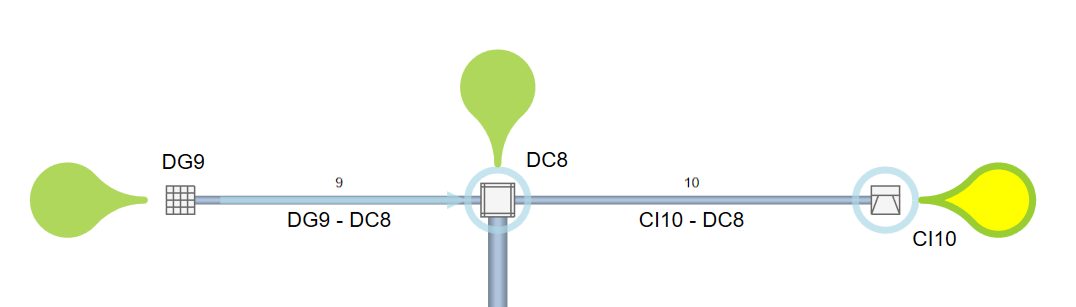
For example, the Drainage Areas option graphically shows drainage areas on your Plan view. This feature allows you to visually display drainage area icons next to each junction that has data inputs for Drainage Area, Runoff Coefficient, Inlet Time and/or Known Q.
This allows you to quickly identify if runoff data has been entered for each inlet. In addition, the icons will alert you if any single data item is missing, for example if you forgot to input an Inlet Time. The icons with missing data will fill with color yellow. They will be green if all data in complete.
Click the icons to view underlying data on the Runoff Input tab. The icons will fill with water after computing results confirming that runoff was generated.
Moving Line IDs and Inlet IDs
The canvas automatically positions your Line IDs along the center of the pipe while the Inlet IDs are located neat the structure. In some instances, however, you will want to reposition them to avoid overlapping. Simply drag the label to a desired location. After a predetermined distance (about 10 pixels), a line leader will be added. After several more pixels, an arrow will be added.
To reset the position to its default, double-click the label.
Gutter Lines
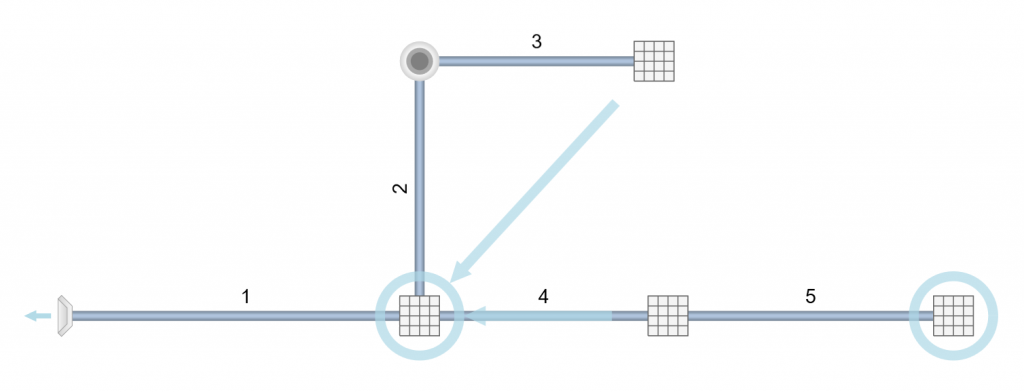
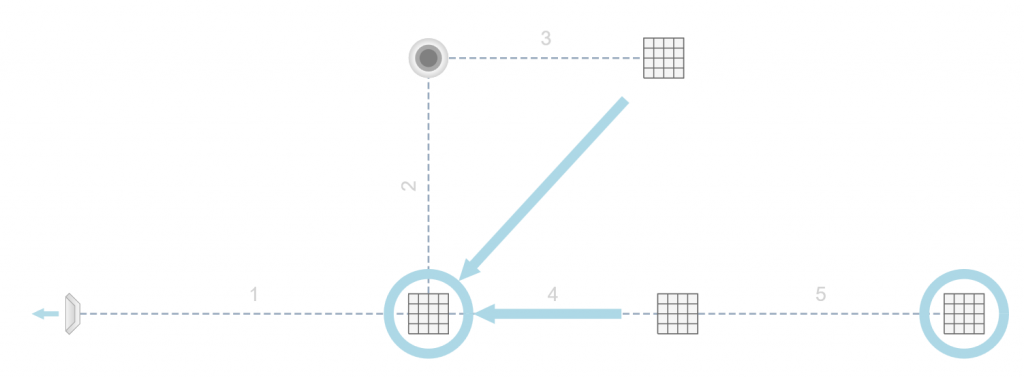
The Gutter Lines option displays lines indicating the layout of the gutters or more specifically, the direction of bypass flows. The system shown below has Gutter Lines turned On. It indicates that Bypass flows from Lines 3 and 4 go to Line 1. Lines 1 and 5 are in Sag locations and thus a circle appears around their inlets.
Surface Diagram
Sometimes it’s more beneficial not to show the actual storm sewer lines but just the surface flows and appurtenances. The system below is shown with the Surface Diagram checked On. The storm sewer lines are shown as dotted lines.
How to Add Custom Labels
Stormwater Studio allows you to annotate your drawing with custom labels. They can be placed anywhere on the Plan drawing and can be of many different fonts and colors.
To add a new label, follow these steps:
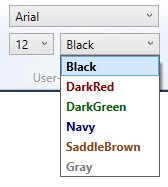
1. Choose the font style, size and color from the Ribbon menu.
 2. Click the [Add Custom Label] button from the side toolbar.

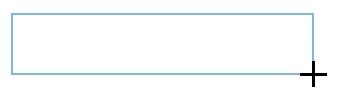
3. Then move your cursor over to the Plan canvas to approximately the desired location, and drag a rectangle and release your mouse button.
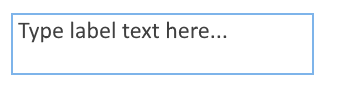
4. Next, type the desired text inside of the rectangle. Note that you can change the font any time, even while typing. You’ll also be able to drag the finished text to a new location.
5. Press the [Esc] key or click [Ok/Select] button on the side tool bar to accept.
Editing Custom Labels
To edit an existing label, simply double-click the label. Make the change and press the [Esc] key or click the [Ok/Select] button.
Moving Custom Labels
Once a label has been added it can be moved by selecting it and dragging it to its new location. That’s all you need to do.
Deleting Custom Labels
To delete a label, click on the text to highlight and then click the [Delete] button on the side toolbar.
