Once your layout is done, you can enter the associated data for each Line. Data is entered into the Data Input window to the right of the layout canvas. The Data Input window consists of three data tabs, each corresponding to a particular category. A fourth tab displays a limited amount of computed results that you can quickly review while working on the Plan, Surface and Profile tabs.
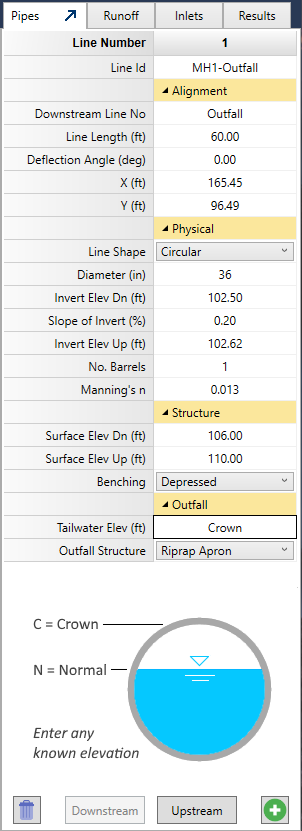
The Data Input window is blank until you select a Line. To select a Line, click on the Line itself or its junction. The selected Line will turn red in color and the input window will populate with its data. You may also select a Line by clicking the [Downstream] or [Upstream] buttons at the bottom of the Data Input window.
Data can be entered on any tab in any order you wish. For example, you can enter all of the Pipes data for each Line in your system first. Then go back and enter all of the Runoff data, and so on.
The input grid behaves very much like an Excel Spreadsheet. To edit a cell, simply double-click or press [F2]. Type in your data item and press [Enter] or [Tab] to advance to the next cell.
To simplify the data entry process, data is broken up into subcategories. These subcategory headings will collapse, hiding data that is not required for that particular case.
Reversing the Order of Pipes Inputs
The input grid, by default assumes you will entering data for each Line working in the upstream direction. In other words, you will encounter the Downstream Invert Elevation first, then the Slope and then the Upstream Invert. The Upstream Invert Elevation will automatically display a default value based on the Downstream Invert and the Slope.
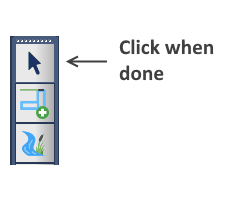
This order can be reversed at any time by clicking the Reverse button shown below.


When the arrow is pointing downward, the order is set to work in the downstream direction.
This feature may be very useful if you have a preference to add your Line “data” starting at the upstream end of your system, where perhaps there is a controlling upstream elevation based on cover or inlet requirements.
Note that it only reverses the Invert Elevation and the Surface Elevation inputs on the Pipes tab. Nothing else is affected by this change. It does not affect the calculations or the way that you add Lines to your system.
Automated Design Options
This software has certain automated design features. Basically, if a particular data item is left blank, for example the Pipe Rise, the program will design it for you. These options will be described in detail within the individual data descriptions in the following sections. See also, Automated Design in Computational Methods.
Data for each Line consists of:
- Pipe Data – Deals primarily with the Line’s alignment, size and invert and surface elevations.
- Runoff – This is where you assign drainage areas, runoff coefficients, inlet times and/or known flows.
- Inlets – This tab contains all the data associated with the Line’s inlet or junction.
Editing previously inputted data is easy and can be done at any time. Data can be edited in the same way as it was originally input. Once a data item is edited, the program immediately updates drawings.
Note that if you have changed any data item after performing calculations, the results will be obsolete. Be sure to re-compute to bring the results current with your latest inputs.
Global Editing
There may be times when you’ll want to edit a single data item for a range of lines. This can be accomplished by first selecting the lines you want to edit and then changing the desired data item in the Data Input window. Note that only the Pipes (not Channels) Physical data can be global edited. Most other data items on the Runoff and Inlet tabs can be global edited.
Notice the Line Number row indicates Selected Set.
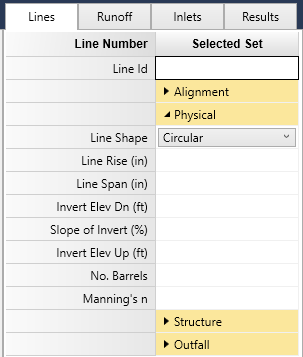
Be sure to click [Ok/Select] when finished.