
Stormwater Studio utilizes integrated rainfall data during its calculations. The software comes preloaded with default data, which is beneficial for familiarizing yourself with the program. However, you will eventually want to configure your own local data. This information is stored in a separate file with an “.idf” extension.
The program efficiently manages this file by automatically opening it at startup and saving any changes upon exit. It is recommended to save the IDF file in your Stormwater Studio/Rainfall Files directory, although you can select any folder of your choice, provided the software can access it at all times. The currently active IDF file is displayed in the Status Bar at the bottom of the Main Window.
If you have created multiple unique IDF curves for different locations, you can easily access any of them whenever needed for your current project.
All rainfall files are integrated within each project file, eliminating the need to send both the .sws project file and the corresponding .idf rainfall file to a colleague.
Conversion from string “#FALSE” to type ‘Boolean’ is not valid
Should you encounter the error message mentioned above upon launching, it indicates that your rainfall IDF file is either outdated or potentially corrupted. In such a case, please open the Rainfall Wizard to review the IDF curves. After examining them, re-save the file. Subsequently, close the Rainfall Wizard, exit the software, and restart it.
Use RainMaps™
The easiest way to setup and localize your IDF curves is to use RainMaps™. RainMaps™ is a cloud-based server which contains Hydrology Studio Suite specific rainfall files you would normally have to set-up in the software either by direct entry of data or importing from NOAA Atlas 14. We’ve taken all of the steps required to create these files so you won’t have to. And they are available with just a couple of mouse-clicks.
If RainMaps™ is not an option for you and you’d prefer to customize, please continue reading.
How to Customize the IDF Curves
Stormwater Studio allows you to customize the IDF rainfall data. It provides a variety of methods to choose from for setting them up. You can also customize the frequencies that are to be used. See Modify Your Return Periods for instructions.
To begin, click the [Rainfall] button on the Ribbon Toolbar to open the Rainfall IDF Wizard.

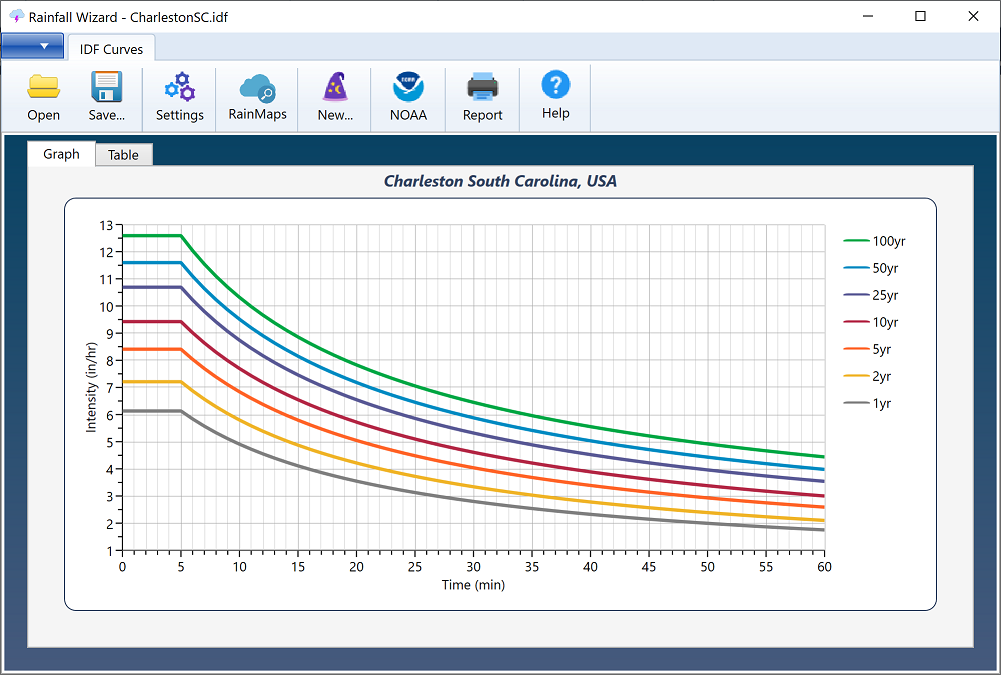
This screen presents the existing set of IDF curves. It is important to understand that IDF curves, regardless of the method employed for their development, are fundamentally based on equations and do not have a time constraint, even though the graph shown only illustrates intensities for a duration of up to 60 minutes.
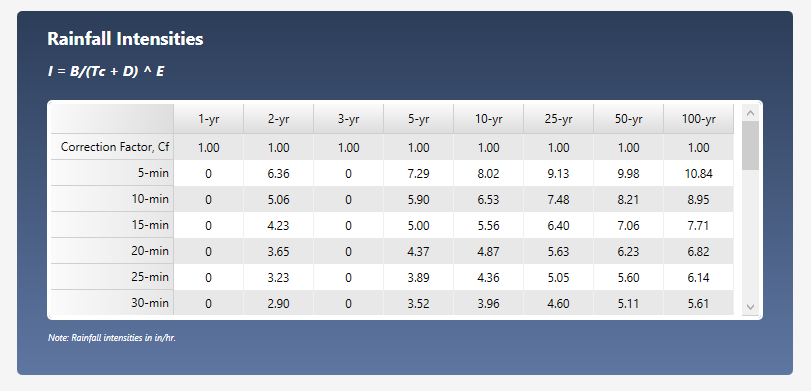
Click the Table tab to view the curves in numeric format. The curves cannot be edited on this screen. It is read-only.
To get started on customizing the IDF curves, click the [New…] button on top.

This opens the IDF Wizard which will walk you through a series of steps.
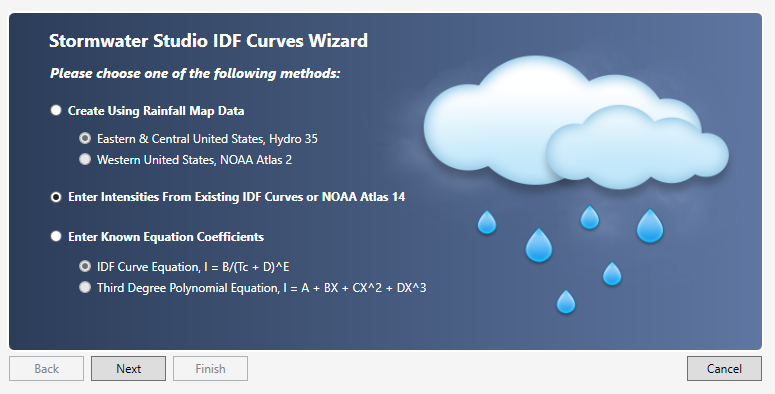
You have three choices to start. Option 2 below is the most popular and is recommended. Select an option and click [Next].
1. Create using rainfall map data
Use this method to enter precipitation values directly from Hydro-35 (Eastern United States) or NOAA Atlas 2 Maps (Western United States). Use this method if your state is NOT listed on NOAA Atlas 14. Read article here.
2. Enter intensities from your existing curves or from the newest NOAA Atlas 14 (Recommended) Read article here.
3. Enter known equation coefficients
Stormwater Studio uses two types of equations, FHA (IDF Equation) and Third-degree Polynomial. You may directly enter coefficients for these rainfall intensity equations. Read article here.