Profiles can be plotted at your convenience, regardless of whether results have been computed. The Profile tab is capable of generating profiles for individual Lines or a group of selected Lines. Various options are available to adjust the horizontal and/or vertical scales, Y Ticks, labeling, and more.
Plotting a Single Line
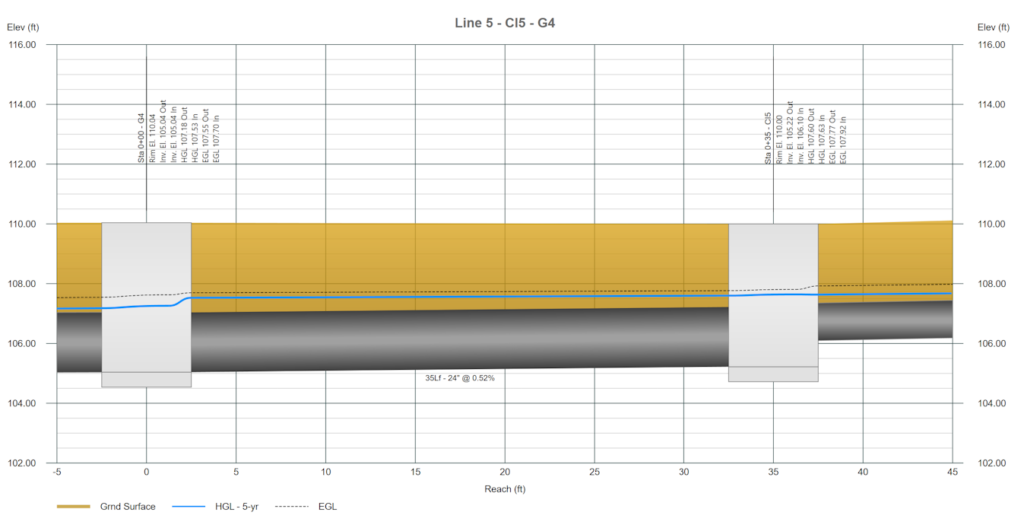
By default a single line will be plotted on the profile. You will be able to navigate upstream or downstream to view other Lines. The single-line plot has the advantage of displaying more detail, especially the inlets.
To plot any Line, click on the Line or its upstream junction on the Plan tab. The chosen Line will change to red, and its data will appear in the input window. Then click the Profile tab. If no Line is selected, Line 1 will be shown by default.

A plot of the selected Line will be shown like below.
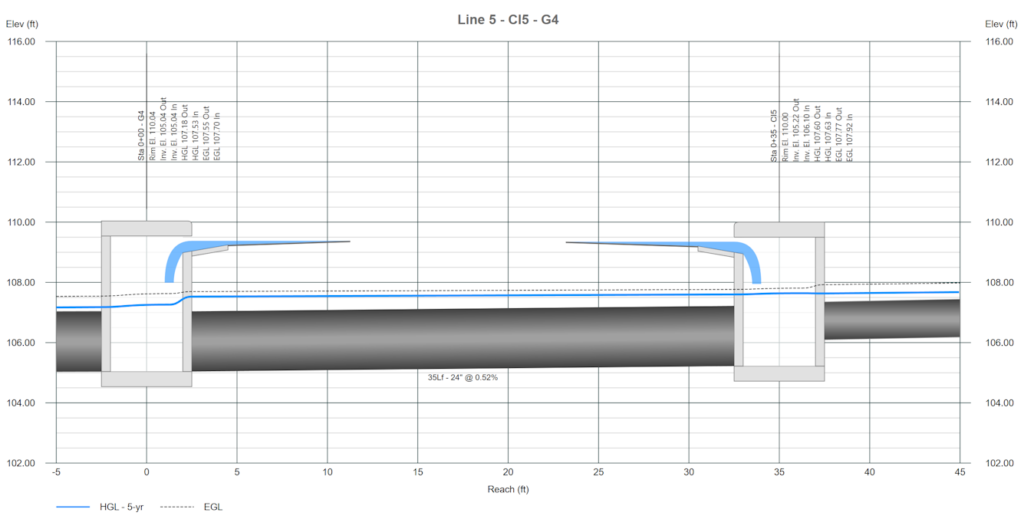
Stormwater Studio provides a special feature for single-line plots which gives more detail to inlets like the one shown above. This detail can be hidden using the Show Inlet Detail toggle button on the top toolbar.
Click to toggle the structure detail for single-line plots. This button is hidden when viewing multi-Line profiles.
Plotting Multiple Lines
To pick multiple Lines, while on the Plan tab, hold down the [shift key] while clicking on a Line or its junction. This action will select all Lines starting from the initial selection and continuing downstream to the outfall along the flow path.
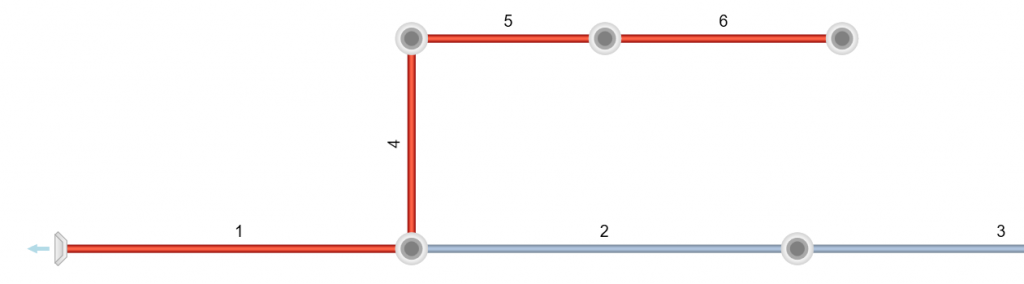
If you wish to select only Lines 4, 5 and 6, for example, select Lines 4, 5 and 6 while holding down the [Ctrl Key]. Deselect Lines by clicking anywhere on the white space.
An alternate method of selecting Lines is by dragging your mouse using the right mouse button on the Plan tab. The software will outline a dashed rectangle around the Lines you select. Any junction within the drawn rectangle will be selected. See Editing Your Plan Layout for more information.
Profile Options
You’ll have many options to customize while creating storm sewer profiles. These options are hosted inside of the tool bar on the upper left of the profile.

Most are self explanatory and include tooltips, but some will be explained from left to right on the toolbar below.
Reset
This button, located on the far left, will redraw the profile using the default settings. Use this if you have unsatisfactorily modified your profile drawing.
Reverse Profile Direction
Use this toggle button to reverse the direction of the X-axis. Profiles can be plotted from either left to right or right to left.
Y Ticks
Toggle button that is connected to the Up/Dn arrow buttons to the right. When toggled On, each click of an arrow button increases or decreases the number of ticks on the Y-axis. There are limits as to how many or few Y-ticks there can be. You’ll here a beep when this limit has been reached.
V Scale
Toggle button that is connected to the Up/Dn arrow buttons to the right. When toggled On, each click of an arrow button increases or decreases the profile’s Vertical Scale. For example, from 1-inch = 2 to 1-inch = 3, 4, 5, etc. There are limits to the Vertical Scale setting. You’ll here a beep when this limit has been reached.
H Scale
Toggle button that is connected to the Up/Dn arrow buttons to the right. When toggled On, each click of an arrow button increases or decreases the profile’s Horizontal Scale. For example, from 1-inch = 20 to 1-inch = 25, 30, 40, 50, 60, etc. There are limits to the Horizontal Scale setting. You’ll here a beep when this limit has been reached.
Label Font Size
Click on the large letter A button to increase the size of the labels. Click the smaller A to decrease the font size.
Download
This function will provide you with the options to save the profile drawing to an image file or to a DXF file. Just choose from the context menu that pops up.
Export to DXF or Image
To preserve the profile drawing exactly as it appears, including Y-Ticks, Vertical and Horizontal scales, etc., utilize this function to save it as either a basic DXF file or a bitmap image. Begin by adjusting the scaling and ticks to your preference, then proceed with exporting. The purpose of this feature is to enable you to import the drawing into a CAD program for additional modifications. For obtaining a high-quality print-out of the profile, refer to the section titled “Printing Profiles” below. Please be aware that a profile with a reversed direction cannot be exported as a DXF file.
Saving Profiles to Reuse
This function allows you to save any selected set of Lines that you have chosen to plot as a profile. This keeps you from having to re-select those lines for a future plot. You can save up to 50 unique profiles per project.
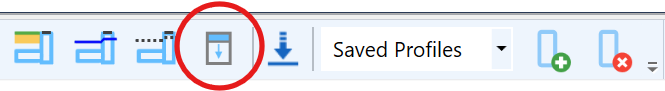
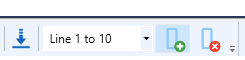
To save a plotted profile, click the Add button next to the drop-down list box. At a later time, just select this saved set to replot.
The program automatically assigns a name for the profile by appending the starting (downstream) Line number and the ending (upstream) Line number to “Line “. As shown above, this profile was named “Line 1 to 10” indicating that the beginning Line is 1 and it flows upstream to end at Line 10.
To remove an unwanted profile, click the Remove button. You will have a chance to cancel.
Please be aware that the Save Profile function does not retain any of the profile settings, including ticks, label sizes, leader positions, and more. Additionally, it is crucial to remove any saved profiles before modifying plan layouts in your system to avoid potential complications if the Lines are linked to an existing saved profile. The software will issue a warning beforehand if such situations arise.
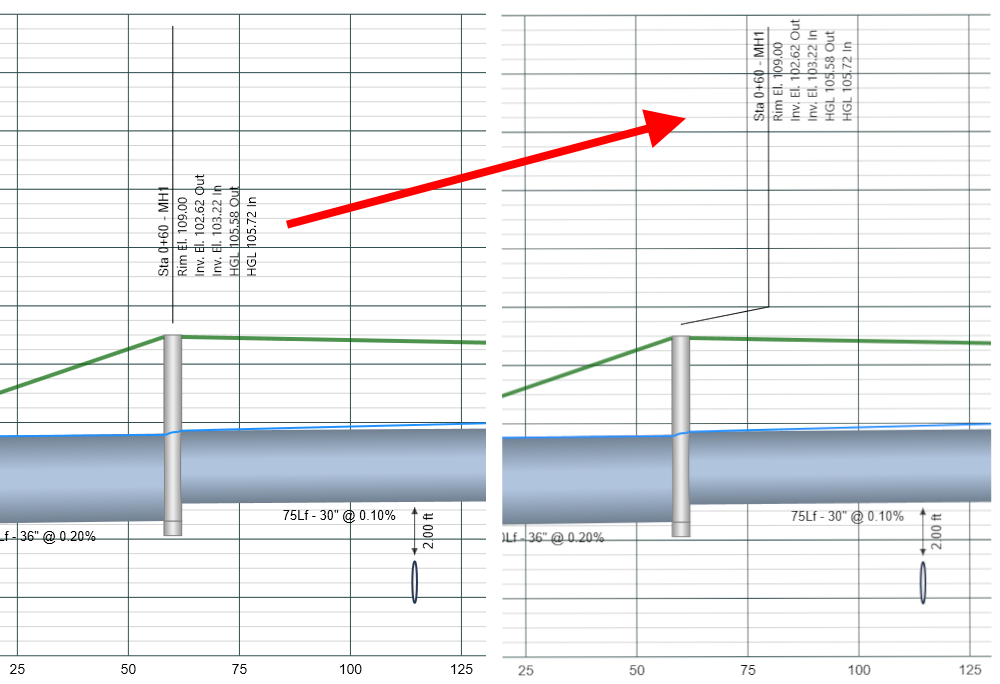
Rearranging the Leader Labels
Sometimes the leaders and labels overlap one another. They can each be relocated by simply moving your mouse over the text on the right side of the leader and dragging to a new location.
Printing Profiles
You can print your profile to a Letter (8.5 x 11), Legal (8.5 x 14) or Tabloid (11 x 17) by clicking the [Print] button on the Ribbon menu. This print button is located only on the Ribbon menu’s Home tab.

Printing Options
While viewing the profile you will have three print options after clicking the Print button:
- Current Profile – This prints the profile as currently displayed.
- Selected Line(s) – This will print each of the selected lines as shown in the profile but as separate page individual Line plots. These are a high quality print-out designed to show more detail than Option 1.
- All Lines – This will print each and every Line in the project as separate page individual Line plots. These are a high quality printout designed to show more detail than Option 1.
Options 2 and 3 will only use the default font sizes, Line leader placements and scaling. These plots will honor the selected toggles for the Surface, HGL and EGL lines.
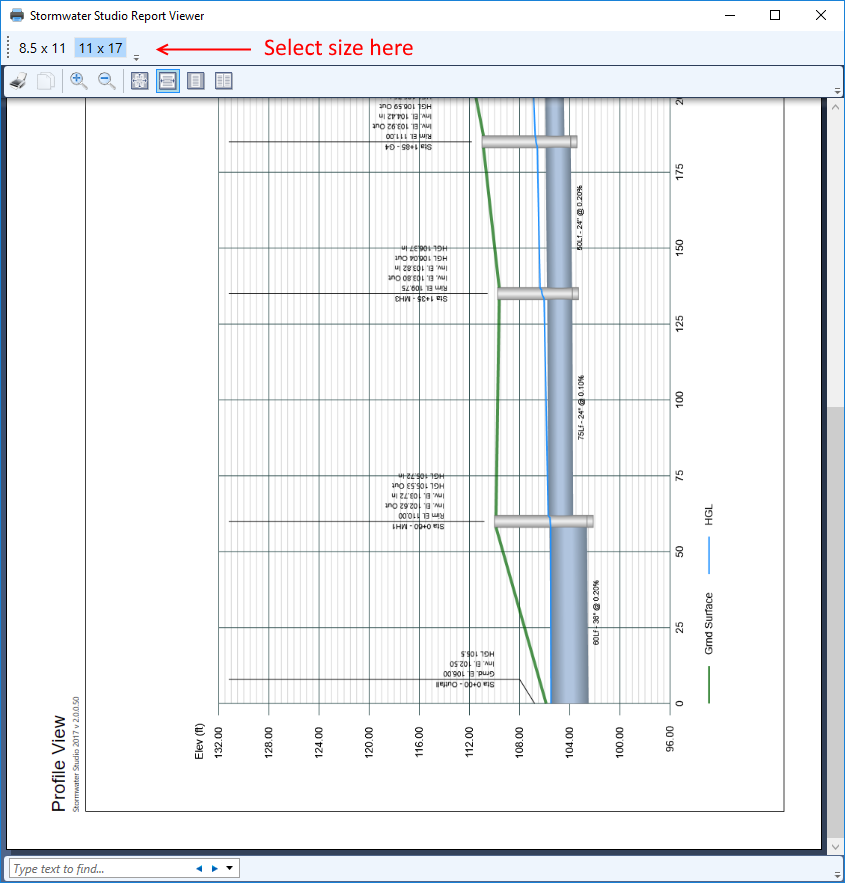
The following print preview screen is displayed. Here you can select the page size while previewing the output. Notice that it will be printed in Landscape to better utilize the printed area.