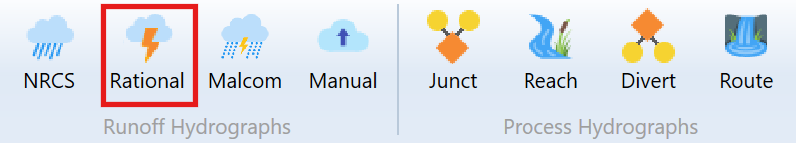
As described in the General Procedure, runoff hydrographs are added to your model by clicking one of the Runoff Hydrograph buttons on the Ribbon Toolbar at the Main Window. In this case, click the [Rational] button. After the icon has been added, simply click on its icon or row, depending on which tab you are working from, to populate its input window. Then fill-in-the-blanks for its data and click [Compute].
IMPORTANT: Rational method hydrographs are best computed on 1-minute Time Intervals. The Time Interval can be changed in Project Settings.
Required Data
The following is a description of each of the required input items. Remember that the program will use the Active Return Periods and the IDF curves as set in the Rainfall Wizard. There’s no need to enter any rainfall data here.
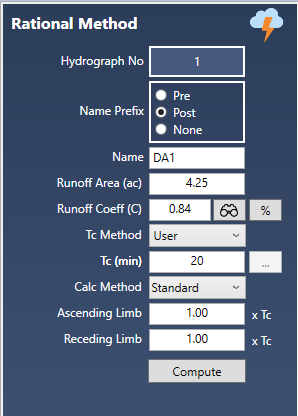
Name Prefix
You can include a prefix (“Pre”, “Post” or nothing to your hydrograph Name field with a single mouse click. This saves precious keystrokes when doing a pre- and post-development study and you want to identify those hydrographs that are “Pre” or “Post” development. The chosen prefix will be added to the front of the Name label on the Basin Model and throughout the software, for example, Tables, Charts, Reports, etc.
Name
Enter any descriptive name for this hydrograph. It will appear on the printed reports as well as the Basin Model.
Runoff Area
Enter the sub-basin area. No size limit but watch for limits imposed by local ordinances, typically 20 acres.
Runoff Coefficient (C)
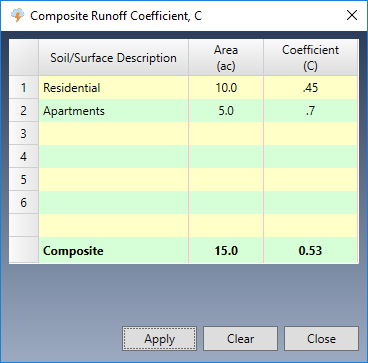
Enter the Runoff Coefficient for this area. A table of coefficients is available by clicking the Lookup button. For a composite C, press the [%] button. Up to six sub-basin areas and corresponding Cs can be entered for a composite C.
Time of Concentration, Tc
Tc is the time it takes for runoff to travel from the most remote upstream point in the drainage area to the downstream point in question.
Note that the minimum Tc for generating intensity is hard-coded to 5-minutes and cannot be changed. So if you entered a Tc less than 5 minutes for one of your Rational method hydrographs, the intensity used to compute the peak Q will be equal to the 5 minute intensity. The hydrograph will still be constructed based on your inputted Tc.
Select one of the following Tc options from the drop-down list box:
User – Check this option to override the computed Tc and enter Tc manually. Rational method Tc must be a whole multiple of the current Time Interval.
TR55 – Compute Tc by using the built-in TR55 worksheet. See Tc by TR55.
If you chose TR55, click the ellipsis […] button to open the TR55 input screen. There, Tc will be computed and automatically inserted into the Tc input box.
Calculation Method
Choose either the Standard Rational or Modified Rational from the drop-down list box.
Standard Rational Method
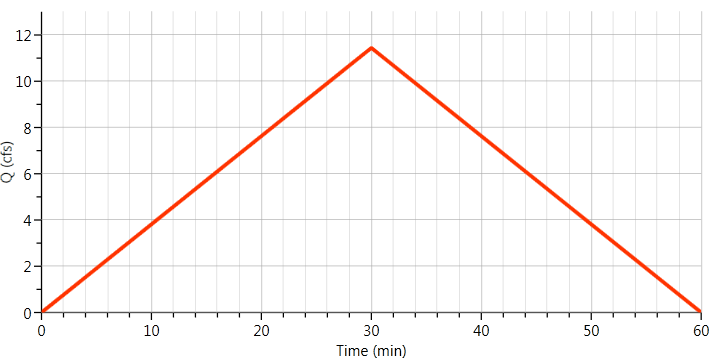
The Standard Rational method simply computes the peak flow, Qp = CiA. Where i equals the intensity pulled from your IDF Curves.
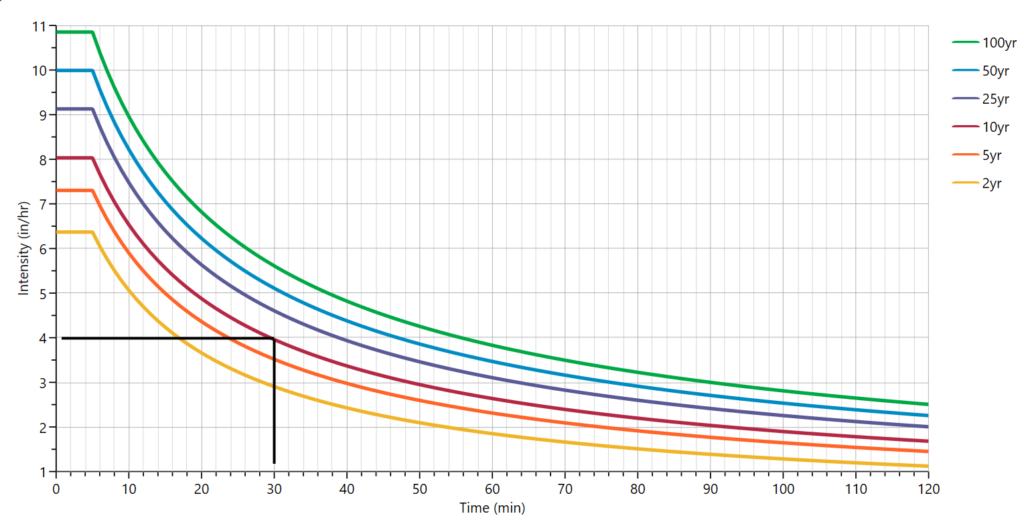
The resulting hydrograph is an isosceles triangle which peaks at Tc (30-minutes).
Ascending Limb (AL)
You can specify an ascending limb factor as a multiple of Tc. This value will place the Time to Peak equal to Tc x AL. Unless you have a special situation that warrants this to be different, leave as 1.0, the default.
Receding Limb (RL)
This value extends the receding side of the hydrograph to Tc x RL. The default is 1.0 which produces the hydrograph as shown above. Below are suggested Receding Limb factors which are based on the runoff coefficient.
| Receding Limb Factors for the Rational Method | |
|---|---|
| Runoff Coefficient (C) | Suggested Receding Limb Factor |
| 0.75 - 1.0 | 1 |
| 0.50 - 0.75 | 1.33 |
| 0.30 - 0.50 | 1.5 |
| <0.30 | 1.67 |
Modified Rational Method
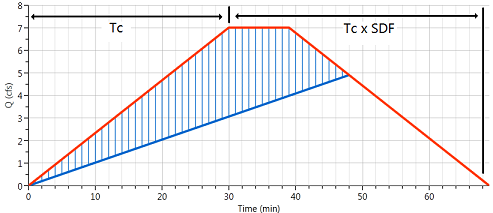
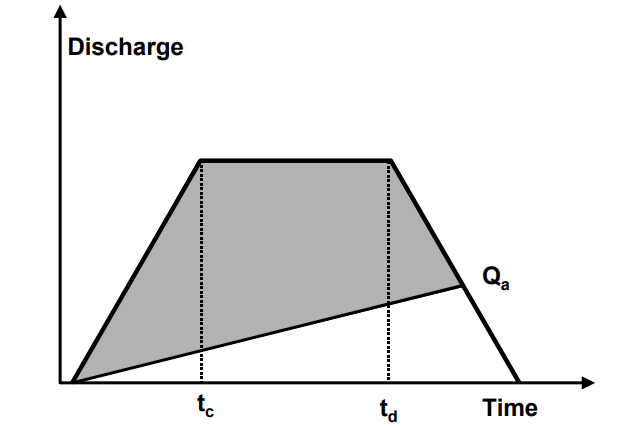
The Modified Rational method takes the Standard Rational to a different level in order to yield a hydrograph for use in detention pond design. The Standard Rational method produces a triangular runoff hydrograph that gives the peak inflow at time = Tc and falls to zero flow at time = 2xTc. This hydrograph represents a storm whose duration equals Tc, resulting in the greatest peak discharge for the given return frequency storm.
The Modified Rational Method uses what’s called the critical storm duration to calculate the maximum storage volume for a detention facility. This critical storm duration is the storm duration that requires the most storage.
The volume of runoff, however, is of greater consequence than the peak discharge in sizing a detention facility. A storm whose duration is longer than Tc may not produce as large a peak Q, but it will generate a greater volume of runoff. By using the Modified Rational method, you can evaluate several different storm durations to verify which one requires the greatest volume of storage with respect to the allowable release rate, Target Q. It is this maximum storage volume that the basin must be designed to detain.
Given that, your objective is to find the total duration (critical storm event) that maximizes the required storage of a detention pond. The user simply modifies the Storm Duration Factor (SDF) between successive routings to arrive at the critical event.
Luckily, Hydrology Studio automatically computes the SDF values for you. Simply plug in the Target Qs and leave the SDF cells blank.
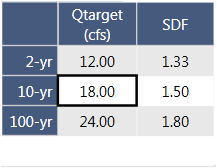
Storm Duration Factors (SDF) are automatically computed.
Entering a Known Critical Storm Duration
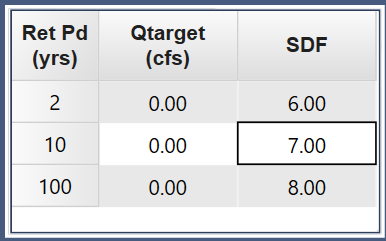
You have the option to input your own SDFs. In such instances, a Target Q will neither be required nor permitted as an input. Additionally, there are situations where the critical storm duration has been determined through alternative methods. For instance, in certain regions of Texas, where adherence to the iSWM (Integrated Stormwater Management Manual) is mandated, the overall storm duration is calculated as follows:
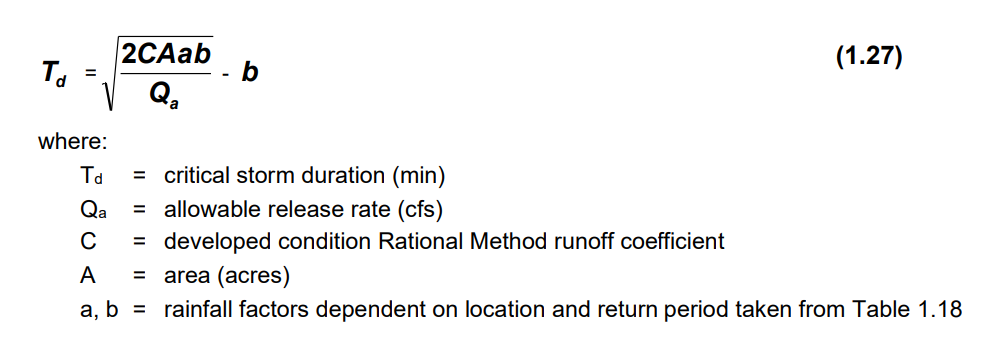
SDF for Hydrology Studio can be found by first hand-calculating Td, dividing Td by Tc. Simply enter the SDF in the table as shown below. Qtargets are not required.
Calculating the Critical Storm Event in Hydrology Studio
Hydrology Studio calculates a series hydrographs (up to 1,000) using increasing Storm Duration Factors in 0.1 increments starting at 1.1. For each hydrograph, it computes the storage volume (the blue hatched shaded area as shown above). The SDF that produces the maximum storage volume is selected as the critical storm.
Note that there are occasions when the SDF produces a hydrograph that has a peak Q that is below the Target Q. The software will stop computing at this point and will provide a note to this effect on the output table.
Hydrology Studio will allow you to see these successive intermediate hydrographs that were generated during its calculations. They can be viewed on the Charts tab by checking on the Show Mod Rational Trials checkbox. Click on any row in the output grid to plot the corresponding hydrograph.
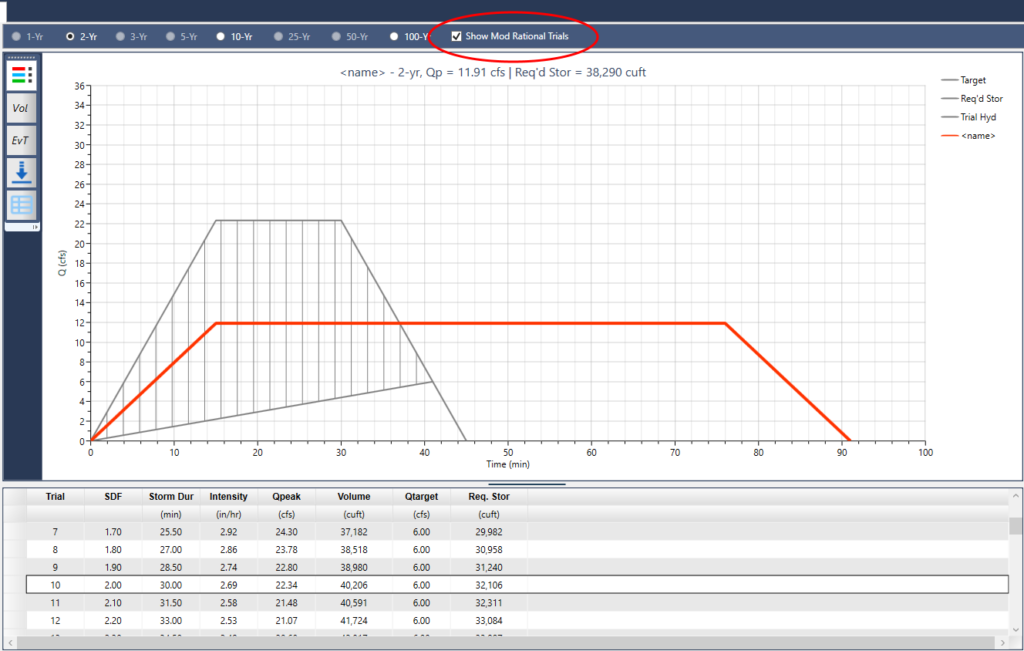
While viewing these results, you’ll notice the Req. Storage column values increasing to a maximum and then decreasing with increasing Storm Durations.
Need to Show Proof?
Right-click on the numeric output table to export the data as a .csv file for importing into a spreadsheet.
A Step-by-Step Example
Here is a highly recommended, step-by-step example of applying the Modified Rational method to a pre and post land development study.