The IDF (Intensity-Duration-Frequency) curves are used for:
- Producing Rational Method hydrographs.
- Creating Synthetic Design Storms when using NRCS hydrographs.
- Producing Malcom method hydrographs.
The software ships with default data for which is useful while getting to know the program. But eventually you’ll want to setup your own local data. The program stores this data in a separate file with an “IDF” file extension.
Hydrology Studio automatically manages this file for you in that it opens it upon launch and saves it when exiting if anything has changed. This IDF file should be saved in your Hydrology Studio/Rainfall Files folder but you may choose any folder you’d like. Just be sure that the software can access it upon launch. The IDF file currently in use is shown in the Status Bar at the bottom of the Main Window.
If you have setup several unique IDF curves for a variety of locations, you can open any one of them at any time to use for your current project.
All rainfall files are embedded in each project file so it is not necessary, for example, to email an associate, the .hys project file and the associated IDF rainfall file.
Use RainMaps™
The easiest way to setup and localize your IDF curves is to use RainMaps™. RainMaps™ is a cloud-based server which contains Hydrology Studio Suite specific rainfall files you would normally have to set-up in the software either by direct entry of data or importing from NOAA Atlas 14. We’ve taken all of the steps required to create these files so you won’t have to. And they are available with just a couple of mouse-clicks.
If RainMaps™ is not an option for you and you’d prefer to customize, please continue reading.
How to Customize the IDF Curves
Hydrology Studio allows you to customize the IDF rainfall data. It provides a variety of methods to choose from for setting them up. You can also customize the frequencies that are (or are not) to be used. See, Choose Design Storm and Return Periods for instructions. See also, Modify the Return Periods for instructions on how to set the return periods to the frequencies that match yours.
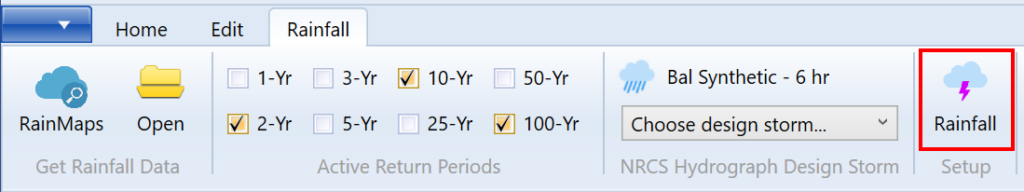
To begin, click the [Rainfall] button on the Rainfall tab to open the Rainfall Wizard.
The Rainfall Wizard window will open as shown below.
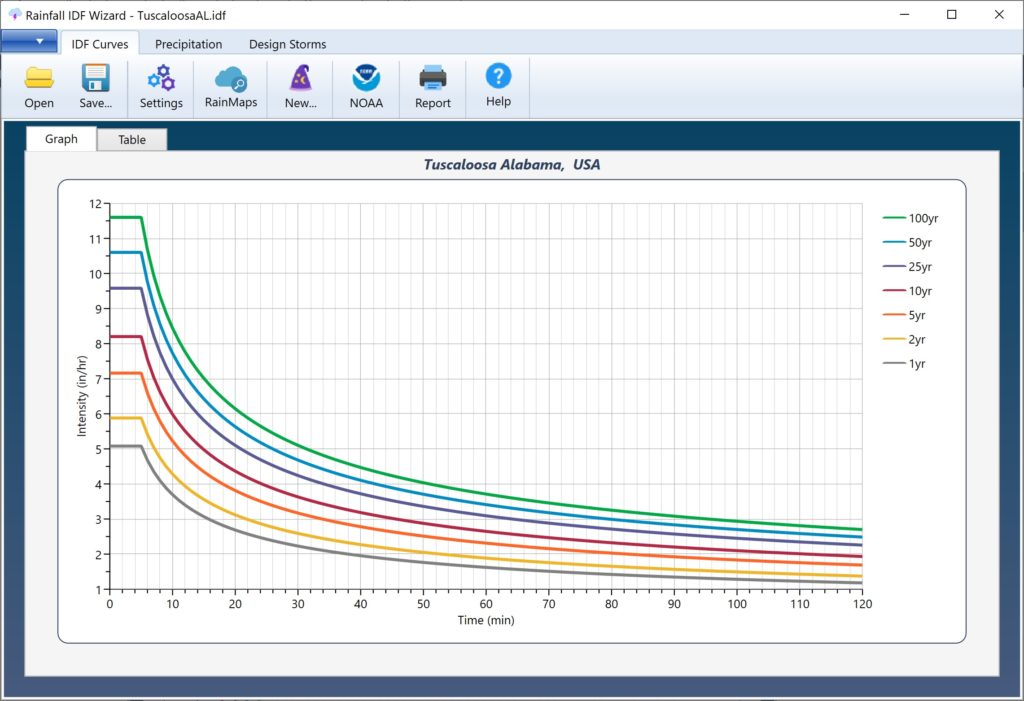
This screen displays the current set of IDF curves. Note that IDF curves, regardless of the method used to develop, are equation-based in the end and have no time limit even though the graph displayed only shows intensities up to 120 minutes.
Minimum Tc
Also note that the minimum Tc for generating intensity is hard-coded to 5-minutes and cannot be changed. So if you entered a Tc less than 5 minutes for one of your Rational Method hydrographs, the intensity used to compute the peak Q will be equal to the 5 minute intensity.
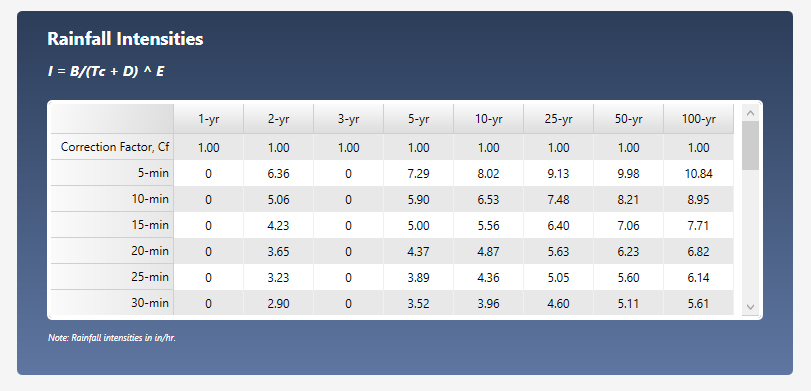
Click the Table tab to view the curves in numeric format. The curves cannot be edited on this screen.
Customize Your IDF Curves
To get started on customizing the IDF curves, click the [New] button on top.

This opens the IDF Wizard which will walk you through a series of steps.
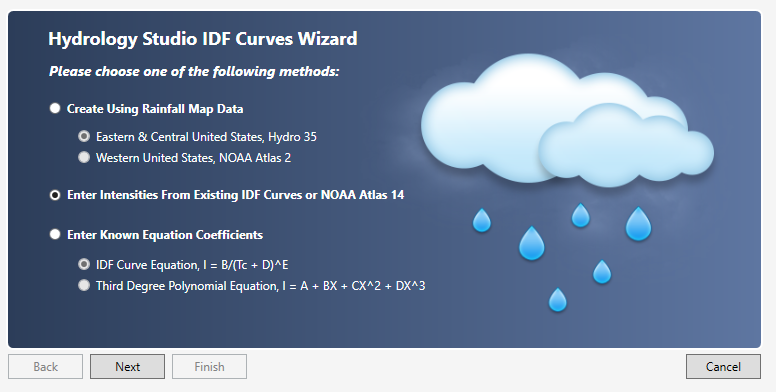
You have three choices to start. Option 2 below is the most popular and is recommended.
1. Create using rainfall map data
Use this method to enter precipitation values directly from Hydro-35 (Eastern United States) or NOAA Atlas 2 Maps (Western United States). Use this method if your state is NOT listed on NOAA Atlas 14. Read article here.
2. Enter intensities from your existing curves or from the newest NOAA Atlas 14 Read article here.
3. Enter known equation coefficients
Hydrology Studio uses two types of equations, FHA (IDF Equation) and Third-degree Polynomial. You may directly enter coefficients for these rainfall intensity equations. Read article here.