This section describes the most common basic tasks you will use when working with Hydrology Studio. It is designed as a “How-To” guide and reference manual. Although it is organized roughly in the order that you would perform the tasks you don’t need to begin at the beginning and work your way through. Every topic contains comprehensive links to background information and other relevant subjects so you can just pick out the task you need to perform and begin.
How to Begin a New Project
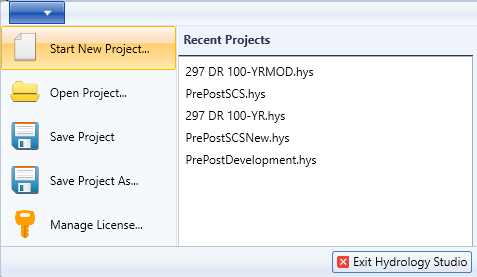
Starting a new project with Hydrology Studio is as easy as creating a new word processing file – you just click on the File menu, select New Project. That’s it. In fact, the program is ready to start a new project upon launch. It also reloads the default rainfall files replacing those which may have been used in a previously loaded project.
User Settings
While it is not necessary, you can open the Settings dialog and specify a Project Title, System Units, Time Interval and a variety of other settings.

To open, click the [Settings] button on the Ribbon Toolbar. These features are discussed in detail in Project Settings.
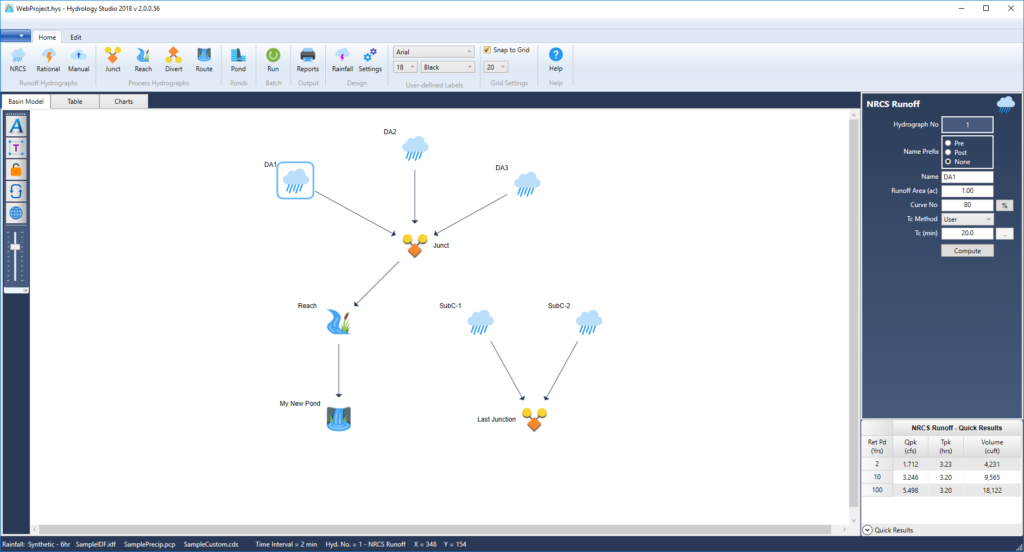
The Main Window
Hydrology Studio’s main window has four main components:
- Application Menu
- Ribbon Toolbar consisting of three tabs (Home, Edit and Rainfall)
- Project Workspace consisting of three tabs (Basin Model, Table and Charts)
- Input Window
Also, at the bottom this screen is a status bar which displays the current rainfall files and the Time Interval.
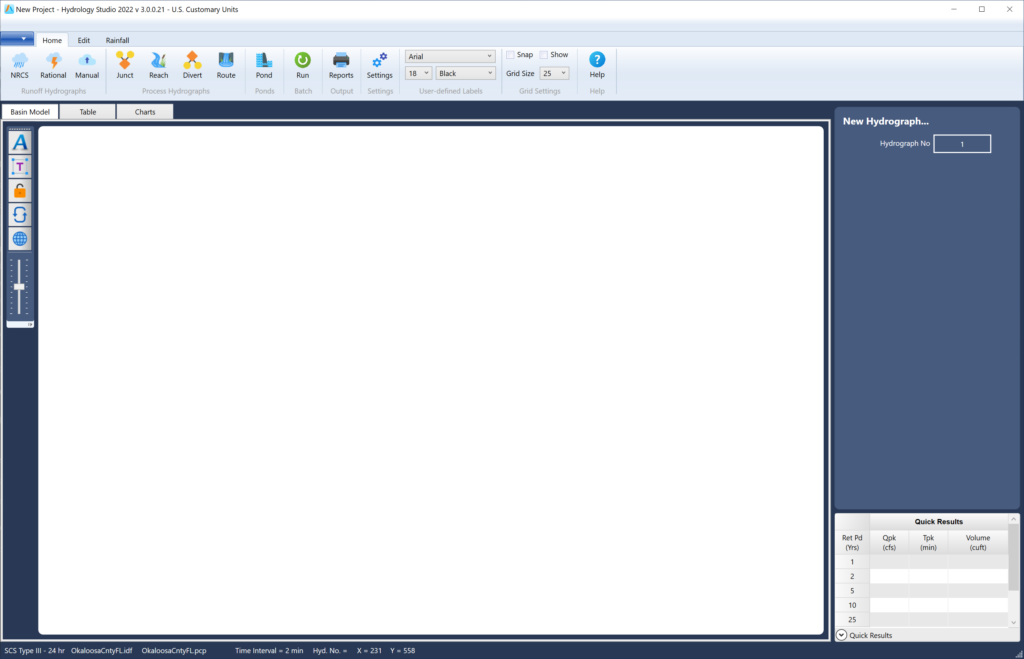
In general, the workspace (the large canvas area) is where you will perform the majority of your tasks. Here you can create and build your watershed basin model, enter numerical data associated with your model, compute and view/print results.
You’ll notice three tabs at the upper left of the canvas:
- Basin Model – The area where you visually construct your watershed schematic
- Table – A numerical version of the Basin Model with key computed results added
- Charts – A graphical and numerical combination of the first two tabs
The Input Window is situated on the right. It is always visible and displays the required input fields for any selected hydrograph. It is here that you will enter numeric data.
Basin Model Components
The basin model, or watershed, is represented by a network of nodes, or hydrographs. These hydrographs are typically connected but it is not necessary. In other words, you can create multiple drainage networks within the same basin model, for example, a pre- and post-development model. There’s no need to create separate project files and switch back-and-forth.
Only hydrographs are shown on the Basin Model. These can be runoff, junctions, channel reach routings, detention pond routings and hydrograph splits or diversions.
Runoff Hydrograph
A drainage area or sub-catchment. Can be generated by NRCS, Rational (including Modified Rational) or direct entry (Manual) methods.
Junction
Represents a confluence in the watershed where two or more hydrographs (up to six at once) are added together or combined into a single hydrograph.
Channel Reach
Represents a uniform stream, open channel or pipe and is used to attenuate or delay upstream hydrograph peak flows using a channel routing calculation procedure. Can accept any type of upstream hydrograph as its inflow, including Runoff, Junction, Reach, Divert, or pond-Routed hydrographs.
Divert
Used to split up any upstream hydrograph into two separate hydrographs. Hydrographs can be diverted using a variety of methods.
Pond Route
Represents a detention pond routed outflow hydrograph and requires a single inflow hydrograph. Can accept any type of upstream hydrograph as its inflow, including Runoff, Junction, Reach, Divert other Route(d) hydrographs.
Hydrograph Numbering
Hydrology Studio can model up to 100 nodes or hydrographs in a single project. Each node must have a unique number and these numbers must begin at 1 and increase as the network progresses downstream. For example, the number of a Junction must be higher than it’s inflow hydrograph(s)’ numbers. Hydrology Studio will manage numbers for you by automatically assigning them as you add nodes to you model. Just remember to always work from the upstream towards the downstream.
Basic Procedure Step-by-Step
1. Add Hydrographs to Your Basin Model
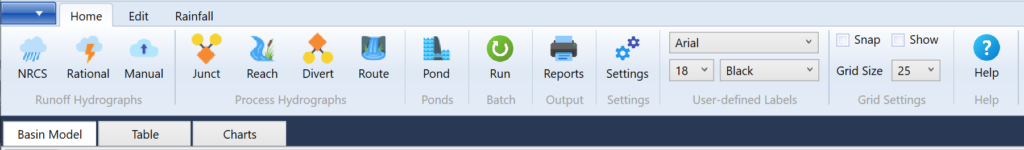
You add hydrographs to your model by simply clicking one of the buttons in either the Runoff Hydrographs group or in the Process Hydrographs group on the Ribbon Toolbar shown below. Your model should always start at its upstream end and work downstream.
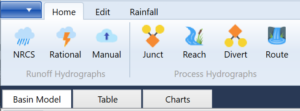
You must first add a Runoff Hydrograph to your model before choosing any from the Process Hydrographs group.
Icons representing each hydrograph are automatically inserted on the Basin Model canvas and assigned a number. You are free to drag these icons around to better match the actual site configuration.
2. Enter the Hydrograph Data and Compute
Selecting a hydrograph with your mouse pointer (clicking an icon on the canvas, for example) populates the Input Window on the right. There you can enter or edit the associated input data as well as compute results.
Hydrology Studio is quite flexible in that it allows you to build your entire model schematically before adding any input data or computing anything. Conversely, you can specify the required data items as you go. It’s your choice. Again, your model should always start upstream working downstream.
In addition, you can work with your model from any of the three workspace tabs described above. You can build more than one model at a time. For example, you can build a separate pre-development model and post-development model in the same project. Models do not need to be connected.
3. Print Reports
You can print reports of your model at any time by clicking on the Reports button.
Here is an excellent step-by-step example on how to build your watershed.
The Basin Model Tab
The Basin Model tab is selected by default when Hydrology Studio is launched. While it is not necessary, this is where most projects will begin and is where watershed diagrams are constructed as it provides a visual of the connectivity of the watershed elements.
Moving Hydrographs
Hydrograph icons are automatically placed on the canvas after clicking on one of the Runoff Hydrographs or Process Hydrographs buttons on the top Ribbon menu. Once on the canvas you are free to move or reposition them to better match a real world layout. Simply click and drag the icons with your mouse. Since the Basin Model is a schematic representation of your watershed, the position of the hydrograph nodes or icons will have no effect on the resulting calculations.
You can also reposition groups of icons by holding down the [shift] key while dragging. All icons downstream of the selected icon will be included in the move.
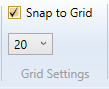
Snap to Grid
You can also have the model automatically snap the icons to a grid to perfectly align them. In addition, you can select the size of the grid by selection from a drop-down list. The Snap to Grid options are available on the main ribbon menu.
Selecting Hydrographs
While constructing your Basin Model you may need to select a hydrograph, or a group of hydrographs in order to add a junction, routing or diversion. Selecting an icon is accomplished by just clicking it. Groups can be selected by just dragging a rectangle around them. For example, three Hydrographs were selected below by dragging a rectangle around them with the mouse.
 After releasing your mouse button, a selection rectangle will surround each of them.
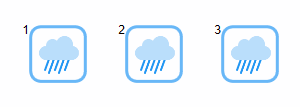
Individual, non-sequential hydrographs, for example 1 & 3, can be selected by holding down your [Shift] key while clicking on their icons.
Once selected, you can create a junction using those selected hydrographs as inflows. The example below shows how a Junction was added by first selecting Hydrographs 1, 2 & 3 and clicking the [Junct] button.

Basin Model Toolbar
This tab contains a left-side toolbar which is used to toggle on/off the icon labels, lock and unlock the basin model layout, redraw the schematic to the programs default layout, load a background map from image files, and to size icons using a slider bar.
![]()
Toggles the hydrograph icon labels from Number; Name; Number & Name; and Off.
![]()
Adds custom labels to your basin model.
![]()
Locks and unlocks the basin model icon layout to prevent inadvertent changes.
![]()
Resets the schematic to program’s default layout. Not available when background map is used.
![]()
Imports or clears a background map from .png, .jpg or .bmp files. All background maps are loaded uniformly to maximize the size. Aspect ratio is preserved.
![]()
Slider bar changes the size of the icons to better match your drawing scale.
Table Tab
The Table Tab is a numerical version of the Basin Model. Here you can get a detailed view of select computed results. Hydrographs can be selected by clicking on a row. Multiple selections are made by dragging your mouse or by clicking while holding down the [shift] key. Note that non-sequential hydrographs, for example, 1, 4, & 6, must be selected on the Basin Model tab as described above.
When adding new Runoff Hydrographs, you must first select an empty row.
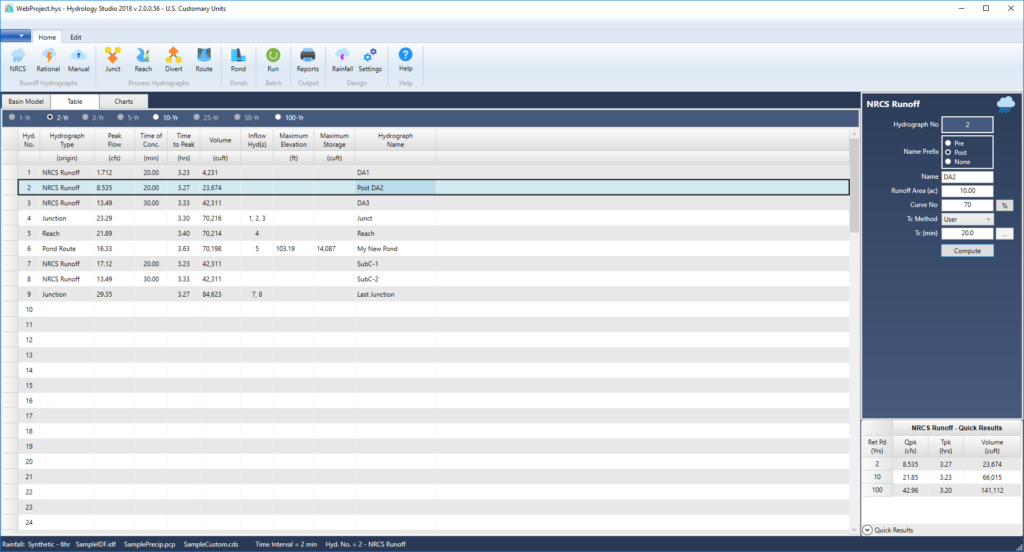
Inserting Hydrographs
Hydrographs must proceed in an ascending numerical order as you work downstream. Because of this there may be occasions when you’ll need to insert or delete a hydrograph. This is easily done on the Table tab by selecting a hydrograph and clicking Insert or Delete on the Edit tab in the Ribbon menu.
Note the frequency selector bar across the top of the table. Click on any active return period option to display the corresponding data.
![]()
Charts Tab
The Charts Tab turns numbers into pictures as well as offering a table of Time vs. Q and Time vs. Elevation. Hydrographs from the Basin Model are listed on the left.
Select a hydrograph to view its corresponding chart. Multiple selections can be made by clicking while holding down the [Shift] key. Use the [Ctrl] key to select non-adjacent hydrographs.
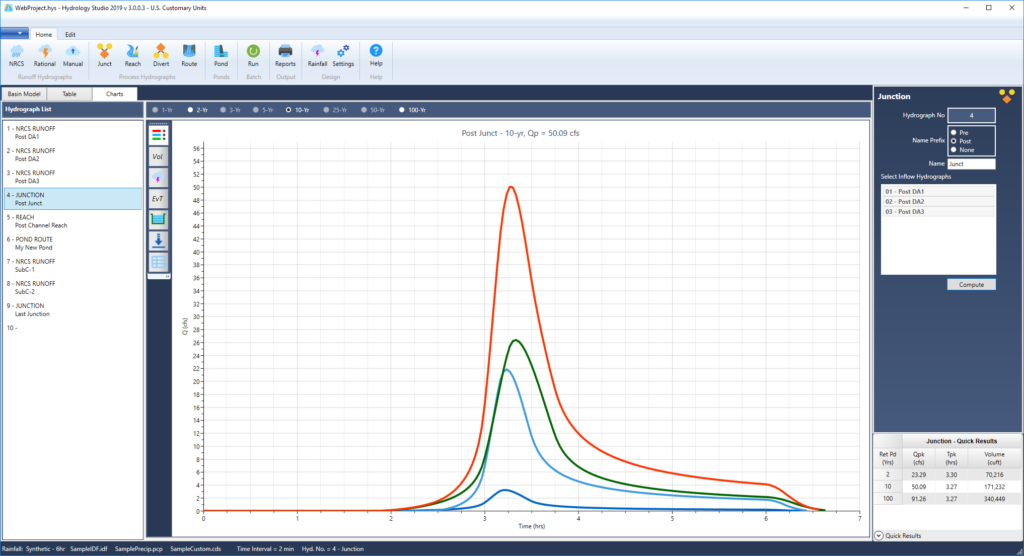
The Chart Tab contains a toolbar on the left with the following options:
![]() Toggles the chart’s legend on/off.
Toggles the chart’s legend on/off.
![]() Toggles an overlay graph of volume vs. time.
Toggles an overlay graph of volume vs. time.
![]() Toggles an overlay of the design storm distribution used. (NRCS hydrographs only).
Toggles an overlay of the design storm distribution used. (NRCS hydrographs only).
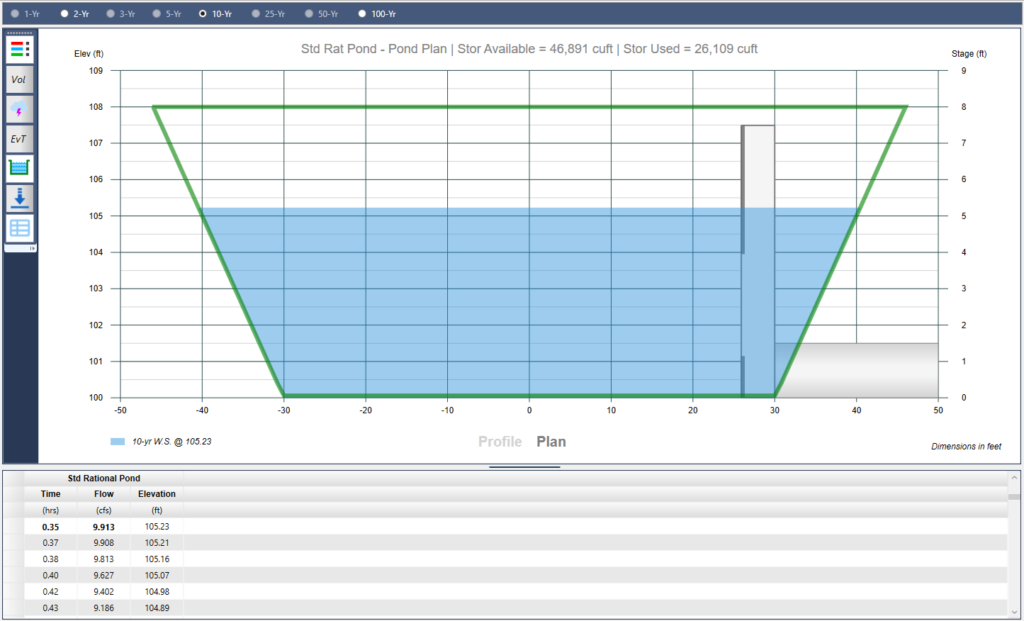
![]() Toggles an overlay graph of elevation vs. time. (Pond routing only).
Toggles an overlay graph of elevation vs. time. (Pond routing only).
![]() Toggles between the hydrograph plot and a detention pond Plan or Profile plot.
Toggles between the hydrograph plot and a detention pond Plan or Profile plot.
![]() Export the displayed chart to an image file as bmp, jpeg or png format.
Export the displayed chart to an image file as bmp, jpeg or png format.
![]() Toggles on/off the tabulated Q vs. Time table. This also shows Time vs. Elevation on Pond Route plots. Click on any row to see the corresponding elevation in your detention pond. Hold your Arrow Up/Dn keys to see a simulation.
Toggles on/off the tabulated Q vs. Time table. This also shows Time vs. Elevation on Pond Route plots. Click on any row to see the corresponding elevation in your detention pond. Hold your Arrow Up/Dn keys to see a simulation.
Note the frequency selector bar across the top of the table. Click on any active return period option to display the corresponding data.
![]()
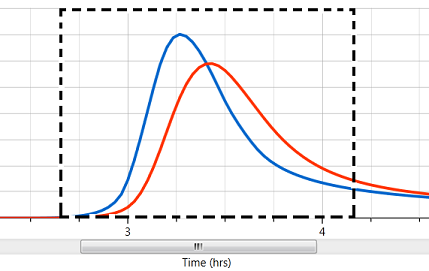
How to Zoom a Chart
Any chart in this software can be zoomed by simply dragging a rectangle from the upper left to the lower right of a desired viewport. Double-click the chart to return to full extents.
Saving Projects
In terms of printing, saving and opening files, Hydrology Studio works like a word processor. You can save and open your project files to or from any folder at any time as well as print reports. See Saving and Opening Projects for more information.