There may be occasions when you’ll need to specify a hydrograph by direct entry as it may have originated from other hydrology software or source. Hydrology Studio allows you to enter or import a hydrograph, one for each return period.
To add a Manual Hydrograph, click the [Manual] button on the Ribbon Toolbar. After the icon has been added, simply click on its icon or row, depending on which tab you are working from, to populate its input window. Simply fill-in-the-blanks and click [Compute].
Required Data
The following is a description of each of the required input items. Remember, it’s easier to use the Tab key when navigating between input items.
Name Prefix
You can include a prefix (“Pre”, “Post” or nothing to your hydrograph Name field with a single mouse click. This saves precious keystrokes when doing a pre- and post-development study and you want to identify those hydrographs that are “Pre” or “Post” development. The chosen prefix will be added to the front of the Name label on the Basin Model and throughout the software, for example, Tables, Charts, Reports, etc.
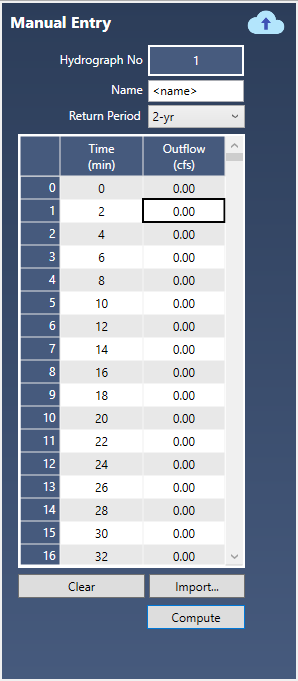
Name
Enter any descriptive name for this hydrograph. It will appear on the printed reports as well as the Basin Model.
Return Period
Select a return period from the drop-down list.
Time vs. Outflow
The time units are already filled in using the current Time Interval. The Time Interval can be changed in Project Settings if needed. Simply type in the corresponding outflows for each time increment. Click [Compute] when finished. Repeat for each desired Return Period.
Importing a Manual Hydrograph
A hydrograph can be imported from any .txt or .csv file. The imported file must be in the following format where the first item in the file is the Time Interval in minutes, followed by flow rates beginning at Time = 0.
Time Interval in minutes
Q0
Q1
Q2
Q3
.
.
Qn
Where:
Time Interval = dt in minutes
Qn = Outflow at Time n minutes
n <= 2,880
An Example File
A sample file with a 5-minute time interval which peaks at 50 minutes may look like this. Notice the first value in the file is the Time Interval. The remaining numbers are the flow rates beginning at Time zero, then every 5-minutes thereafter.
5
0
1
2
3
4
5
6
7
8
9
20
9
8
7
6
5
4
3
2
1
0
Paste Values From the Clipboard
You can also copy your values from any source and paste them directly into the input table. The copied set does not need to include the Time Interval.
To paste, right-click on the table in the Outflow column and select, “Paste values from the clipboard”.