Channel Studio will model open channels with any shape of channel section including predefined and user-defined. It can model up to 100 river reaches with up to 100 cross-sections. Each cross-section can be described with up to 250 station, elevation points and can be a “Channel”, “Bridge”, “Culvert” or “Weir” section.
You can also add a background Map from either an image file, DXF or LandXML file containing Parcels, Alignments or Plan Features. Additionally, you can import a TIN Surface from which you can cut cross-sections.
Channel Studio was designed to be easy to use while performing hydraulic analysis on most any open channel system which can include natural or man-made channel sections, bridges, culverts and weirs. The user-interface was designed to minimize inputs, messy dialog boxes and put everything right in front of you.
Below is the opening screen with an existing project Loaded.
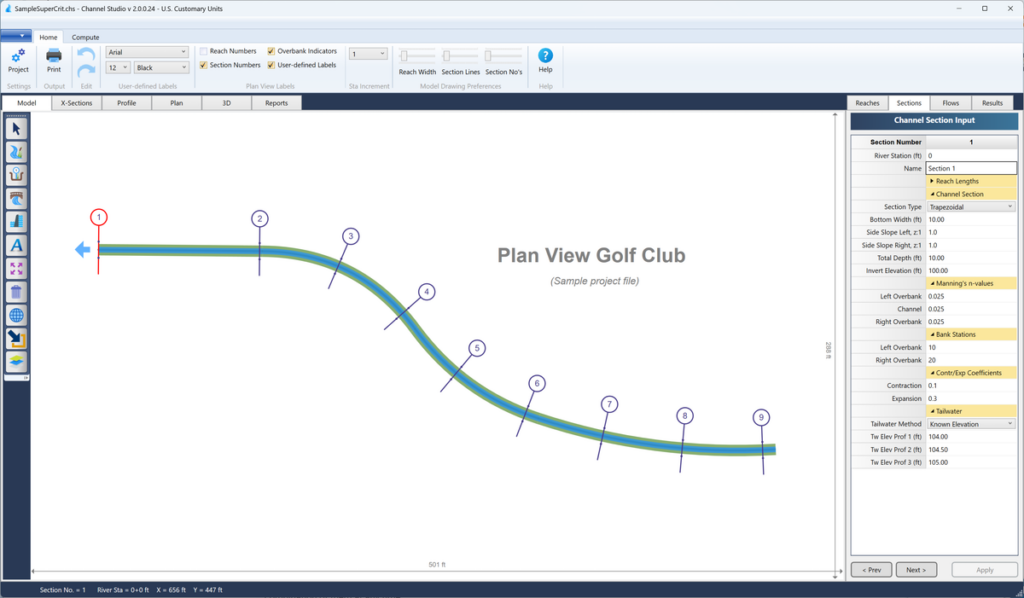
Here you’ll see a heavy green line which is a typical river reach that has lines crossing it at various intervals indicating channel cross-sections. After computing there will be a blue center indicating current results.
Your basic workflow consists of:
- Drawing in the river reach
- Adding the channel cross-sections to the reach
- Adding data to the cross-sections
- Computing the results
It’s very simple and it results in comprehensive output in a short amount of time.
Primary Working Tabs
You’ll see a set of tabs at the top of the main window, used for graphically manipulating, importing, exporting and viewing your model, as well as a set to the right. These tabs, Data Input tabs, are used for entering and editing associated numeric data. What’s important about these is that you can view and work on any combination of them at any time.
In the upper left are five tabs from which you’ll use to setup, manipulate and compute your channel model.

Model
You’ll use this tab when starting a new project. Here you will draw your river reaches, add, insert and remove cross-sections along those reaches, import background maps, data, TIN Surfaces and more.
X-Sections
The X-Sections tab displays cross-sections and allows you to graphically manipulate them.
Profile
Automatically displays a profile of your model.
Plan
Automatically draws a coordinate-based plan view of your finished model. This is the screen where you can export your plan model to a TIN Surface or DXF file.
3D
Automatically draws a 3-dimensional perspective view of your model as looking upstream.
Reports
Shows screen examples of your printed reports. Print-preview is also available during printing.
Data Input Tabs
To the right you’ll find a second set of tabs used primarily for inputting cross-section and flow data. Any of these tabs can be viewed while working on the primary tabs described above.

Reaches
Displays an input grid you’ll use to edit the Reach coordinates as needed.
Sections
This displays an input grid you’ll use to enter geometric data to describe the channel sections.
Flows
Here you’ll enter flow rates for each cross-sections, up to three user-defined profiles, 5-year, 50-year and 100-year, for example.
Results
A separate tab is used for displaying computed results for each individual section.