
Stormwater Studio allows you to enter intensities directly from your existing IDF curves. You can also enter or import intensities from the newest NOAA Atlas 14.
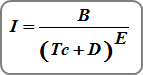
Technically, when using existing curves, Stormwater Studio manipulates your input data to generate coefficients B, D & E, for use in an Intensity vs. Tc equation shown below.
Your best source for this data is from NOAA’s National Weather Service “Precipitation Frequency Data Server”. Click the [NOAA] button on the Ribbon Toolbar to open the web server.

Then select your state and move the red cross hair to your exact location.
Create IDF Curves from Existing Data
Choose Enter Intensities From Existing IDF Curves from the following screen. Then Click [Next].
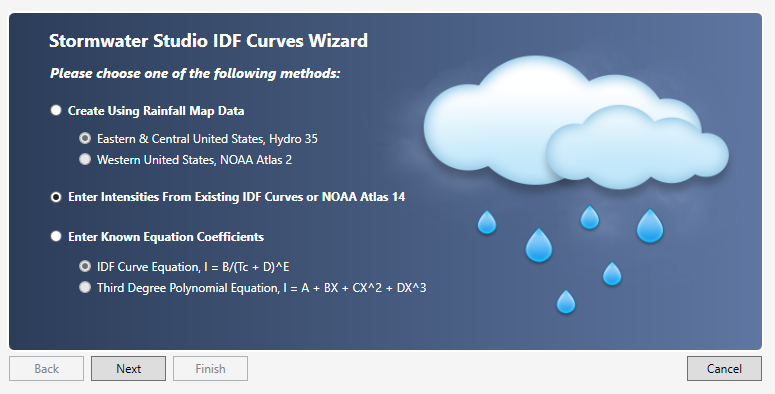
The following screen appears that allows you to input data from either your existing IDF curves or from NOAA Atlas 14. See Importing from NOAA on how to directly import this data.
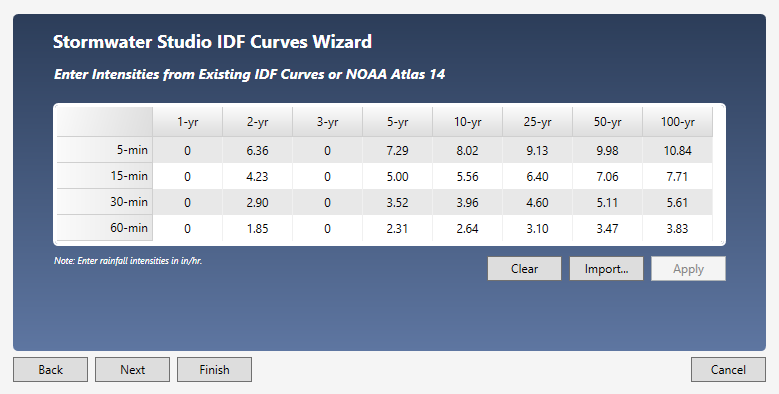
Clear the table and enter intensities directly into the table. (You must supply the 5, 15, 30 and 60 minute values for each return period you want to use.)
Then click [Apply].
Click [Next] if you want to edit Correction Factors. Otherwise, click [Finish]. You’ll be taken back to the initial IDF Wizard screen where you’ll see your new IDF curves.
Save your curves by clicking the [Save] button and specifying a name for your file. An IDF extension will be applied. This file will automatically open each time you launch Stormwater Studio. You can, of course, change this file any time afterwards.
Troubleshooting IDF Curves
There may be occasions when the resulting curves do not exactly match the imported data. The software manipulates your input data to generate coefficients B, D & E, for use in an Intensity vs. Tc equation. In other words the data must plot straight on log/log scale. If it does not, the software will make adjustments to the data so that the data fits the equation.
These adjustments are always within the lower and upper bounds of the 90% confidence interval as shown on the NOAA data tables. Keep in mind that NOAA generates this data from interpolating data points on a GIS grid and this will produce some irregularity as described below.
Nevertheless, if it is crucial for your data to accurately align with the original points, you can employ the charting capabilities in Microsoft Excel. By doing so, you can generate your own coefficients for use in Hydrology Studio’s Third-degree Polynomial equation. Please see, “Create Your Own Equation Coefficients” for detailed instructions.
NOAA Atlas 14 Data May Require Smoothing
Each duration in NOAA Atlas 14 was analyzed separately. For example, the 30-minute value for each frequency was extracted and analyzed for precipitation-frequency. Then the 60-minute value for each frequency was extracted and analyzed for precipitation-frequency. And so-on. Each value has a calculated mean, standard deviation, and skew. No attempt was made to smooth these data across the series of durations for each return period. Thus the NOAA data will exhibit some irregularities.
You can make adjustments to the derived coefficients yourself in order to sway the curve in one direction or the other. For example, if the fitted curve is higher than the original data, adjust the D coefficient upwards until you are satisfied with the results. Do this by following the procedures here.
The NOAA Atlas estimates differ from some of the other resources that I have. Which are more accurate? Which should I use?
NOAA’s precipitation frequency estimates have been endorsed by the Federal Advisory Committee on Water Information’s (ACWI) Subcommittee on Hydrology and are de-facto national standards.