If you’ve read the previous article, “Rational Method vs. SCS Method“, then you’ll have some background information on this one. Here we are going to dig a little deeper into that comparison and walk you through the steps we used to arrive at the Modified Rational method results.
This article will teach you how to perform a pre- and post-development study using the Modified Rational method.
We could have chosen any of the other two methods (Standard Rational or NRCS) but the Modified Rational can be confusing to some who have never used it before. So hopefully this will enlighten. The process for the pond sizing and outlet structure design is basically the same, regardless of the runoff hydrograph method(s) used.
If you’d rather read a tutorial on using the NRCS method, please visit “My First Pre/Post Development Project”.
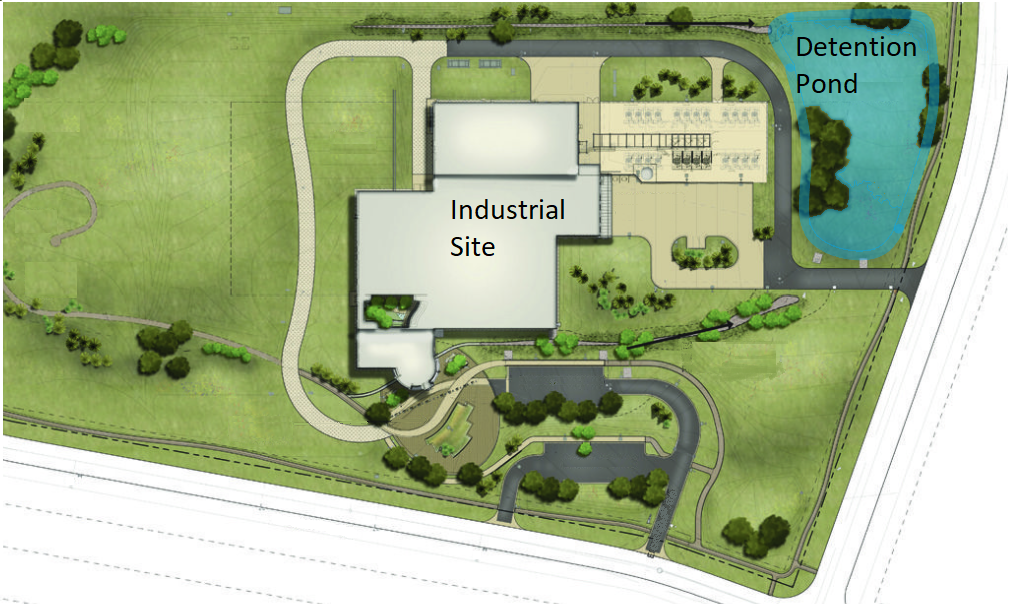
A 10-acre Site in Atlanta, Georgia
To recap, our scenario is based on modeling a pre- and post development project on a ten-acre site in Atlanta, GA that transforms a “Meadow in good condition” to an “Industrial site”. We modeled using NOAA intensity and precipitation rainfall for the 2, 10 and 100-year return periods. Pre- and post-developed runoff hydrographs were created using the appropriate runoff coefficients (C) and Times of Concentration (Tc).
The pre-developed hydrograph was created using the Standard Rational method. The post-developed hydrograph was developed using the Modified Rational method and using the peak Qs of the pre-developed. More about this below.
After that, a new detention pond was designed using the pre-developed peak Qs for the target release rates. The post-developed Modified Rational hydrograph was the pond’s inflow hydrograph.
Here are the inputs and the resulting basin model:
Modified Rational Data Inputs
| Area (ac) | 10.00 | |
| Pre-developed | Runoff Coefficient (C) | 0.30 |
| Tc (min) | 30 | |
| Post-developed | Runoff Coefficient (C) | 0.85 |
| Tc (min) | 12 |

Step 1. Create Pre-developed Hydrograph
The Standard Rational is always used for the pre-developed because all we want are peak Qs for use in the post-developed hydrograph. We added a Rational method icon by clicking on the Rational Method button on the top toolbar. Next, we added the following data and clicked [Compute].


The peak Qs are 7, 10 and 15 cfs for the 2, 10 and 100-year events respectively. These are the Target Qs we’ll use to create the post-developed hydrograph in the next step.
Here is the resulting 100-yr hydrograph shown on the Charts tab but all we really need are the peak Qs.

Step 2. Create Post-developed Hydrograph
Repeating Step 1, we added a second Rational method icon by clicking on the Rational Method button on the top Ribbon toolbar and added the following data.

The Modified Rational was selected for the Calculation Method and we entered the Peak Qs from Step 1 for the Qtargets. Note that we left the Storm Duration Factors blank (TBD). The software automatically computes these for us after clicking [Compute].
Click [Compute]. Then click the Charts tab to view the results in graphical form.

Remember, the objective of the Modified Rational method is to find a total duration that maximizes the blue-shaded region you see in the above chart.
Remember, the objective of the Modified Rational method is to find a total duration that maximizes the blue-shaded region you see in the above chart.
The Storm Duration Factor (SDF) is what is being calculated by the program. It does so by creating a series hydrographs (up to 1,000) using increasing SDFs in 0.1 increments starting at 1.1. For each hydrograph, it computes the storage volume (the blue hatched shaded area as shown above). The SDF that produces the maximum storage volume is selected as the “Critical Storm”.
In this chart, the SDF = 7.2. Thus 7.2 x Tc + Tc = 98.4 minutes total duration. In the Standard Rational, SDF is always 1.0.
Here are the charts overlaid. Do this by selecting Hydrographs 1 and 2 while holding the [Shift] key down.

Step 3. Design a Detention Pond
Now that we have created the pre-and post-developed hydrographs, we can design a detention pond with release rates that match the Pre-developed Qs. Again, the pre-developed peak Qs are 7, 10 and 15 cfs for the 2, 10 and 100-year events respectively.
Hydrology Studio uses a three-step procedure for easy detention pond design.
Step 1. Estimate Required Storage
We clicked on the [Pond] button on the top toolbar which opened the Pond Designer Window. Here we entered the following:

All we did was select Hydrograph 2 for the “Post-dev Hyd” and Hydrograph 1 for the “Pre-dev Hyd” as shown above in the drop-down list boxes (The Q target inputs will be filled in automatically). Then clicked [Estimate Storage]. The software provided us with an estimate of the maximum storage needed for the 100-year event. This is how large our pond should be… 69,877 cuft. We used this number to build our actual pond. (Very close to what was estimated when computing the Modified Rational hydrograph, 69,789 cuft.)
Step 2. Create a Detention Pond
We clicked [Create Pond >] to advance to the second step in our detention pond design. As indicated in the previous article, we settled on using a standard Trapezoidal-shaped pond. It must be 8-feet deep; have 1 foot of freeboard; and have 2:1 side slopes. All we needed to do was find a bottom dimension (L x W) that provided us with a total volume of at least 69,877 cuft at 7 feet of depth. After a few trials of Bottom Length & Width, we arrived at the following 80′ x 80′ pond.


Keep in mind that the storage estimate in the previous step is just that, an estimate. The final result may be somewhat different. Next we clicked [Outlet Struct >] to advance to the final step.
Step 3. Build the Outlet Structure
We wanted to build a multi-stage outlet structure that resembled this:
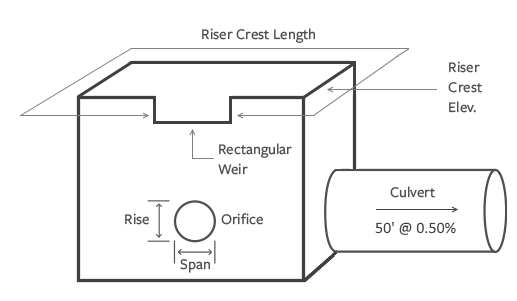
The Culvert needed to be 50 feet in length at a 0.50% slope. Our aim was to use a 4′ x 4′ box Riser that held a combination of orifices and weirs to satisfy our target Q requirements. We did not want the Riser’s top to be used as weir.
We used Hydrology Studio’s interactive features so we first chose to view the Structure Schematic. The screen initially looked like this:

We also made sure to select the 100-yr Ret Pd row on the Trial Route table.

The goal now is to add outlet devices, one-by-one, downstream towards upstream, until we have satisfied our release rate requirements. The exact procedure follows:
1. Added the Culvert
Designing not by return period but from downstream to upstream, we first added a Culvert using the initial design constraints stated above. Just to get something on the screen, we selected a 12 inch diameter, circular culvert. Then clicked [Add/Update], and then [Trial Route].

As shown on the Trial Route table above, the 100-year event failed. If you click on the Trial Route radio button you’ll see exactly when and where it failed. Obviously we needed to increase the size of the Culvert so we increased the 12 to a 15-inch. Then clicked [Add/Update] and [Trial Route] again. The routing succeeded but the Q actual fell just short of our Target and it left a little more freeboard than we wanted. We want to make the most of our pond storage.

We went one size up and settled for an 18-inch. Yes, its Q Actual will exceed the target but that’s the point. We want the Culvert to be large enough to pass the 100-yr return period, not less because that will require a larger pond. We’ll just use secondary structures to control the 100-yr event. (This is a typical scenario due to being limited to commercially available pipe sizes). If you can’t closely reach your target Q (rarely happens), always go to the next size up.
2. Added a Riser
We knew we would be using a Riser as a container for the secondary devices, so we added it next. This also helps the visual. We added the data but did not attempt a Trial Route because nothing can escape the pond now. The inputs are as follows:

We set the crest elevation high so it won’t contribute to outflow. Can be adjusted later.
With only a Culvert and Riser, the pond schematic looked like this:

3. Added an Orifice (2-Yr)
The next structure to be added (working downstream to upstream) is the orifice, which corresponds to the 2-year event. We used Orifice 1. Like the Culvert, we made a first guess at the size, a 12-inch. The orifice data is as follows.

Then clicked [Add/Update] and [Trial Route]. The routing succeeded but the 2-year Q Actual fell short of our Target of 7 cfs. We simply made size adjustments upwards while performing Trial Routes until we met our 2-year target. That size came to 14 inches. The structure (front view) now looked like this as it displays the routed 2-yr water surface.

We noted the maximum 2-year water surface elevation of 103.69. This will be the elevation at which we set our next upstream structure, corresponding to the 10-year event. You’ll see this on the Trial Route table below.
At this point do not pay attention to the 10 and 100-year events. Those come later.

4. Added another Orifice (10-Yr)
The next structure to be added (working downstream to upstream) is another orifice (Orifice 2), which corresponds to the 10-year event. Like Orifice 1, we made a first best guess at its size of 12-inches. We set its invert elevation to just-above the maximum elevation of the 2-year routing at 103.70. Then clicked [Add/Update] and [Trial Route].
The first routing exceeded the target Q but after making adjustments and performing Trial Routes, we quickly arrived at 8.25 inches. Here is the resulting structure and trial routing results.

This is where we will set the invert for the 100-year outlet device.

Note that we first attempted to use a rectangular weir as shown in the multi-stage structure drawing above but we could not satisfy both 10 and 100-year events without overflowing the Riser. This is typical of a Modified Rational inflow hydrograph due to its linear shape along its peak line.
5. Added a third Orifice (100-yr)
The 2 and 10-year events are complete and close to perfect. Moving further upstream we added a final orifice, Orifice 3, to satisfy the 100-year.
Remember, the Culvert was sized too large to be used for this event so we knew we would need to add a separate secondary structure for this.
We simply repeated what we had done for the previous orifice. We added our standard best-guess 12-inch and set its invert at the maximum water surface elevation reached during the previous, 10-year event routing at 105.00. Inputs are:

Then clicked [Add/Update] and [Trial Route]. The routing succeeded but the Q Actual exceeded our Target of 15 cfs. We simply made size adjustments downwards while performing Trial Routes until we met our 100-year target. That size was 9.25 inches.
Here is the final structure and the routing results.


Near perfect routing results. Plus, we honored our 1-foot of freeboard within 0.01 feet.
Step 4. Perform the final Pond Routing
Once our pond design was completed, we clicked the [Finish] button to close out the Pond Designer and return to the Basin Model at the Main Window. Even though the pond structure was designed, we still needed to finish out the basin model and perform the real routing.

We selected Hydrograph 2 (Post Mod Rational) and clicked the [Route] button on the Ribbon toolbar. This added the Pond Route icon to the Basin Model.
Selecting the newly added icon populates the Pond Route input window as shown below.

We gave it a name, “Mod Rational Pond”, and clicked [Compute].
Here is the final result.
The Modified Rational method assumed a required storage of 69,789 cuft. The actual was about 10 percent less at 62,229 cuft. This is due to the concave shape of the outflow hydrograph rather than the assumed straight line.
Conclusion
Hopefully this article provided some insights into the Modified Rational method and the proper steps to take when designing a detention pond.
Always use the Standard Rational for the pre-developed condition. Take those peak Qs and enter them as Target Qs in the post-developed condition using the Modified Rational method. The Modified Rational method hydrograph will be used as the Inflow into your detention pond routing.
Always build your pond outlet structures by adding them in the order from downstream to upstream. Size them to satisfy their corresponding return period release rates before moving to the next upstream structure. Set their inverts equal to the Max. Elevation reached during the previous structure’s routing. Avoid using the Riser as a controlling device. Follow this same procedure on all of your detention pond designs and you will succeed 99 percent of the time, usually within about 15 minutes.
Using the Riser as a Controlling Structure
For those who are interested, the structure below uses the Riser to control the 100-year event instead of an orifice. In order to satisfy the maximum release rate, the freeboard was reduced to 0.80 feet. At the target release rate, the total head above the riser crest is 0.15 feet.
This riser weir, with a 12-foot crest length, exceeded the target rate by 20 percent after the pond silted up just 0.20 feet. Not good.
By using a riser weir to control, you run the risk of significantly breaching the target release rate by a disproportionate increase in head, commonly a result of a poorly maintained pond bottom. For example, this riser weir, with a 12-foot crest length, exceeded the target rate by 20 percent after the pond silted up just 0.20 feet.
Certainly one could argue that this arrangement is more economical in that it has one less orifice and the riser box is shorter… but at the expense of downstream effects.
By NOT using the Riser for a weir, you’ll always know when something is wrong with the pond performance in futures years. If you see water flowing over the top, there’s a problem. Most likely the pond has silted up and needs attention.

When Your Freeboard is Higher than Needed
Your pond is designed but you noticed some leftover, unused storage. That’s good news! This means you can downsize the pond. Simply return to your pond and adjust the bottom widths, contours, etc. Then return to your outlet structure and repeat the steps outlined above. It is highly recommended you deactivate, or even delete, each outlet device and start over, working downstream to upstream.
More about the Rational and Modified Rational methods can be found here.
Learn more about Hydrology Studio’s complete suite of stormwater design software.
- Hydrology Studio
- Stormwater Studio
- Culvert Studio
- Channel Studio
- Studio Express
Visit Hydrology Studio today.