Your procedure for creating hydrographs is similar to those with all of the other tasks in Studio Express. Simply select the desired hydrograph type; fill-in-the-blanks for its data and click [Compute].
To develop an NRCS method hydrograph, please select it from the drop-down list box on the input grid or choose from the canvas.
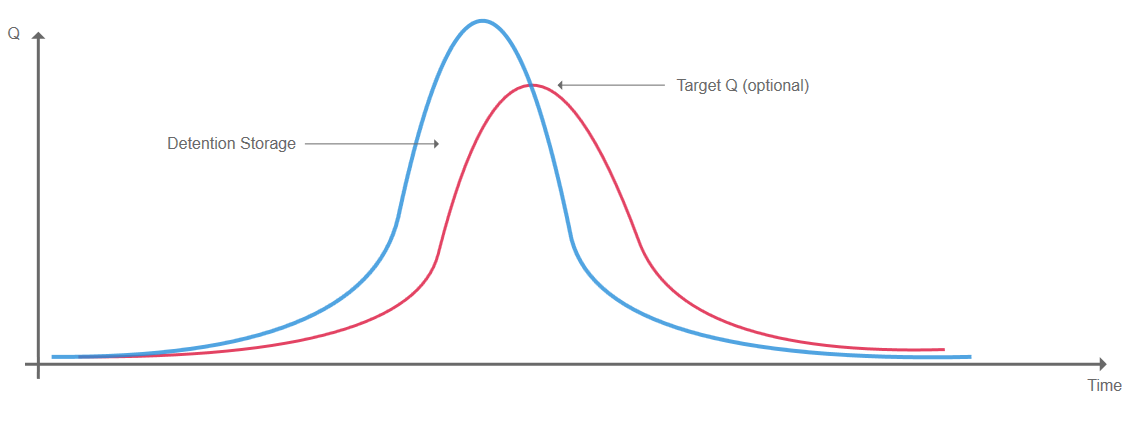
All hydrographs in Studio Express are automatically computed in 1-minute time intervals, i.e., a Q value is computed for each minute of time. In addition to computing hydrographs, Studio Express allows you to input a target Q for establishing preliminary storage estimates for detention pond sizing.
Methodology
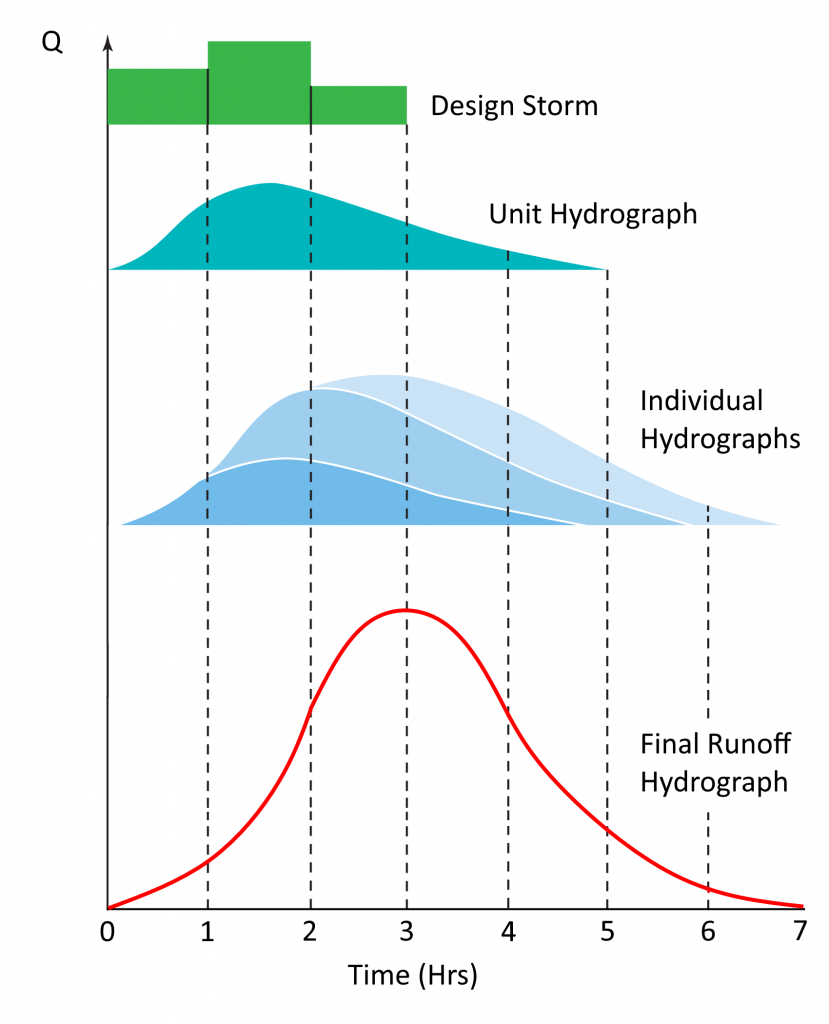
Studio Express uses the NRCS (SCS) Unit Hydrograph Method for calculating NRCS runoff hydrographs. This method is the same approach as used in the original TR-20. There are basically four steps involved.
- A Design Storm is selected (Typically an NRCS 24-hr distribution)
- A Unit Hydrograph is constructed based on the drainage area’s characteristics, i.e., Curve Number (CN), Tc, etc.
- The Design Storm is applied to the Unit Hydrograph by multiplying each ordinate of the Design Storm by each ordinate of the Unit Hydrograph, creating a series of Individual Hydrographs.
- The Individual Hydrographs are summed to create the Final Runoff Hydrograph.
NRCS Input Requirements
The following is a description of each of the required input items.
To enter data, type in the value or select from a drop-down input box, and press [Enter] or the [Tab] key. Following is a description of those required items. Once the data is input, results are computed by clicking the [Compute] button at the bottom of the input grid.
Data is divided into three categories;
- Drainage Basin (physical characteristics)
- Rainfall (Design Storm & Return Period)
- Storage Estimate (optional)
While entering data for the first time, the canvas will automatically display help diagrams to assist in your data entry and the input grid will show only required data items.
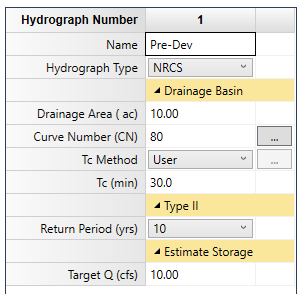
Hydrograph Name
Optional but it is a recommended input as it is this label that identifies the hydrograph on the hydrographs List and reports.
Drainage Basin
Below is a description of all inputs.
Drainage Area
Enter the sub-basin area in acres (Hectares). No size limit.
Curve Number, CN
Enter the NRSC (SCS) Curve Number for this area. A table of suggested CNs is available here.
The CN varies according to the Hydrological Soil Groups (A, B, C & D). The SCS hydrological soil groups are described as:
Group A soils have low runoff potential and high infiltration rates even when
thoroughly wetted. They consist of deep, well-drained sands or gravels and have a high rate of water transmission.
Group B soils have moderate infiltration rates when thoroughly wetted and consist
mainly of moderately well drained soils with moderately fine to moderately coarse textures. These soils have a moderate rate of water transmission.
Group C soils have low infiltration rates when thoroughly wetted and consist primarily of soils with a layer that impedes downward movement of water and soils with moderately texture. These soils have a low rate of water transmission.
Group D soils have high runoff potential. They have very low infiltration rates when
thoroughly wetted and consist of clay soils with a high swelling potential, soils
with a permanent high water table, soils with a clay layer at or near the surface, and shallow soils over nearly impervious material. These soils have a very low
rate of water transmission.
Composite Curve Numbers
For a composite CN, press the ellipsis […] button. Up to six sub-basin areas and corresponding CNs can be entered for a composite CN.
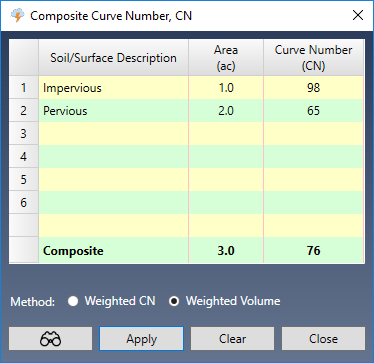
Calculation Method
You’ll have two options for computing the final runoff hydrograph when using composite CNs.
- Weighted CN – This method will simply use a single CN value which is a weighted composite based on area. This method will produce acceptable results when the rainfall amounts are greater than 4 inches (100 mm) and the CNs are fairly close. Unlike the example shown above.
- Weighted Volume – This method is recommended and will always produce the correct result. Instead of computing a single hydrograph using a single composite CN, it generates hydrographs for each specified Area and associated CN. It then adds these together to generate the final hydrograph.
Due to the nonlinear character of NRCS hydrograph equations, inaccurate runoff estimates can result when mixing pervious impervious surfaces within a drainage area using a weighted average Curve Number. This combination can imply a significant initial loss that may not actually take place and will be particularly acute for small rainfalls where the large (but incorrect) initial loss can be 50 percent or more of the total rainfall, thus underestimated the total runoff.
For this reason, we highly recommend employing the Weighted Volume method as it is always correct, regardless of the CNs and rainfall amounts.
Here are two hydrographs generated using both methods. Notice the dramatic difference between the two when the rainfall is below 4 inches (100 mm).
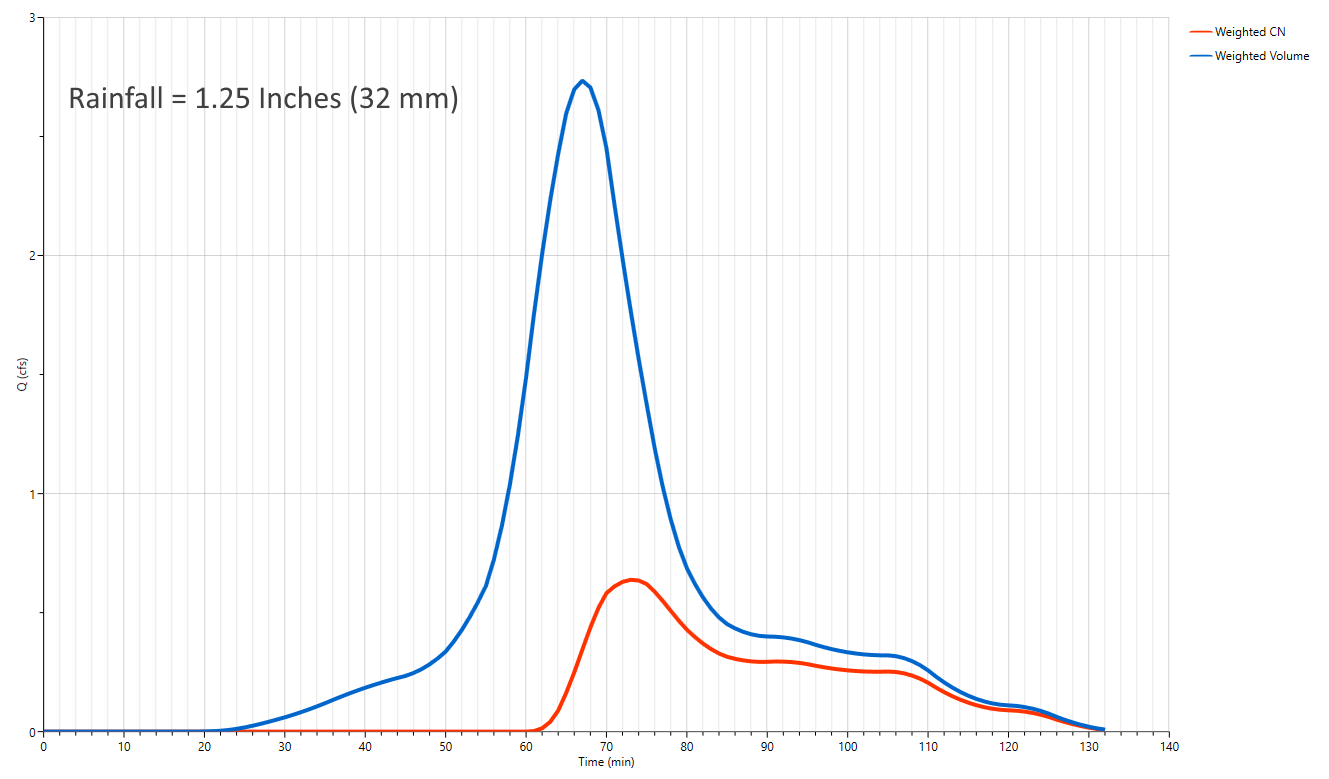
Weighted Volume produces much higher volume and peak flow with small rainfall.
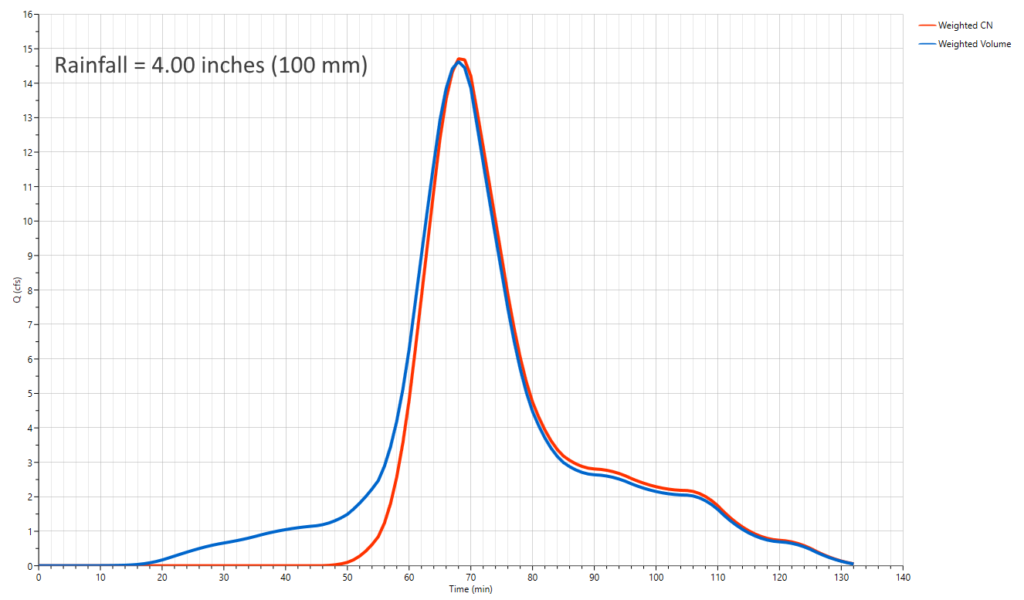
With higher rainfall both methods produce hydrographs that are nearly identical.
Time of Concentration, Tc
Tc is the time it takes for runoff to travel from the most remote upstream point in the drainage area to the downstream point in question. Select one of the four Tc options from the drop-down list box.
User – Check this option to override the computed Tc and enter Tc manually.
TR55 – Compute Tc by using the built-in TR55 worksheet. See Tc by TR55.
Lag – The TR-20 default method.
Kirpich – This method is normally used for natural basins with well defined routes for overland flow along bare earth or mowed grass roadside channels. It is similar to the Lag method but will typically give shorter times compared to the Lag method. Use this method when the subarea is dominated by channel flow.
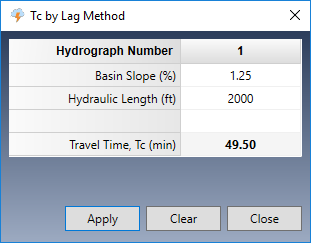
Both Lag and Kirpich methods require:
Basin Slope (%)
Enter the average slope of the basin in percent.
Hydraulic Length
Enter the total distance the runoff travels from the most remote upstream point in the drainage area to the downstream point in question.
If you chose Lag, Kirpich or TR55, click the ellipsis […] button to open the corresponding input screen. There, Tc will be computed and automatically inserted into the Tc input box.
The Shape Factor
One important component to the NRCS hydrograph is the Shape Factor. It is assumed that all NRCS hydrographs in a given project will use the same Shape Factor, typically 484.
This factor is higher in mountainous watersheds, for example, 600, while in flat, sandy areas, will be lower, around 300. The Delmarva peninsula in Delaware uses 284.This value can become smaller in coastal regions. Check local ordinances. This value can be changed in the Project Settings.
Rainfall, Design Storm & Return Period
Remember that the program will use the Precipitation and IDF curves as set in the Rainfall Wizard. There’s no need to enter actual rainfall data here.
Design Storm
This is selected in the Rainfall Wizard. The name of the currently selected Design Storm will be displayed here. To select a different design storm click the Rainfall button on the top ribbon menu and then click the Precipitation tab. There can you activate the Design Storm. Learn more here…
Return Period
Select a return period from the drop-down list.
Estimate Storage
This is an optional item.
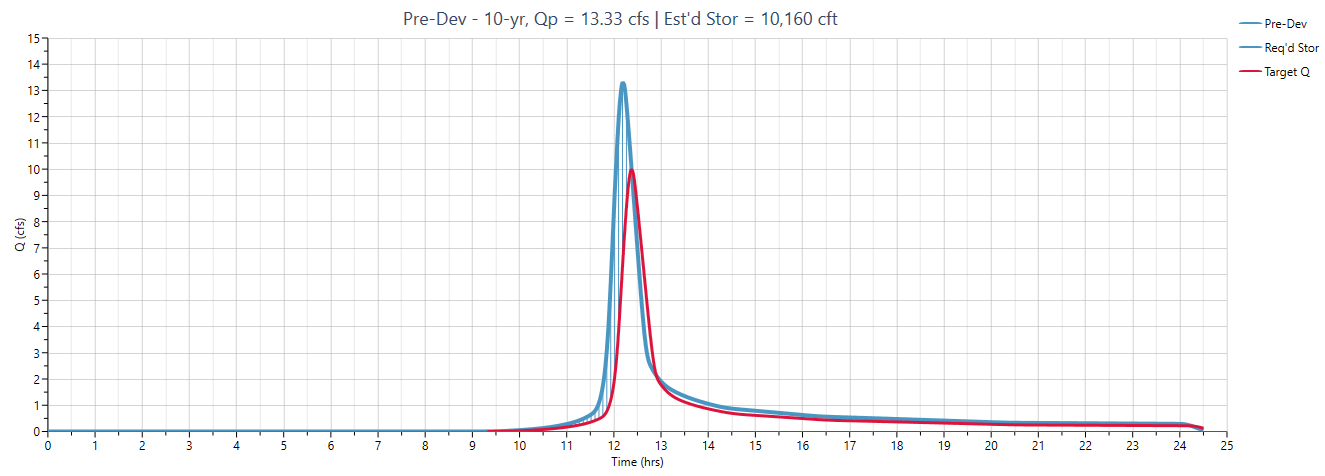
Target Q
Enter a flow rate that represents an outflow. This is typically equal to a pre-developed site condition. This Q must be less than the computed peak Q of the hydrograph.
Computing Results
Once you entered your data, click the [Compute] button at the bottom of the input grid.
Studio Express will first do a data check to make sure the inputs are okay. You’ll then be presented with the results.
You can clear the data from the input grid by using the [Clear] button.
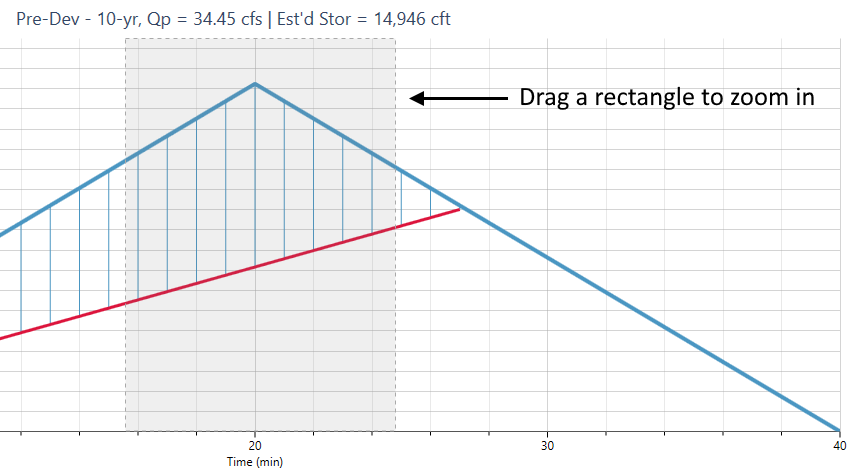
How to Zoom a Chart
Hydrograph plots can be zoomed by simply dragging a rectangle from the upper left to the lower right of a desired viewport. Click the Refresh button to return to full extents.