Your procedure for creating hydrographs is similar to those with all of the other tasks in Studio Express. Simply select the desired hydrograph type; fill-in-the-blanks for its data and click [Compute].
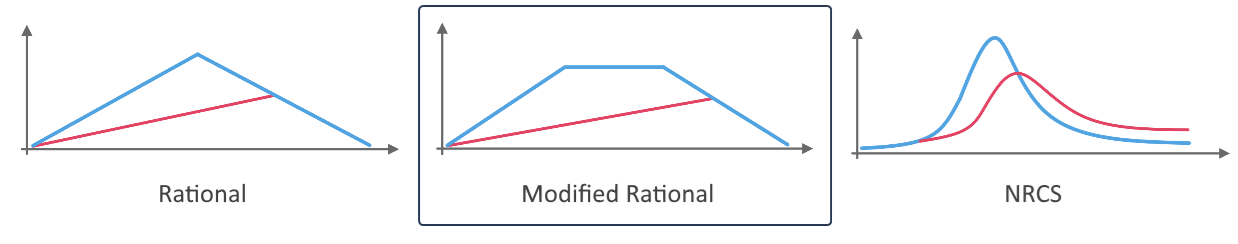
To develop a Modified Rational method hydrograph, please select it from the drop-down list box on the input grid or choose from the canvas.
All hydrographs in Studio Express are automatically computed in 1-minute time intervals, i.e., a Q value is computed for each minute of time. In addition to computing hydrographs, Studio Express allows you to input a target Q for establishing preliminary storage estimates for detention pond sizing.
The Modified Rational method takes the Standard Rational to a different level in order to yield a hydrograph mainly for use in detention pond design. According to the Rational method, the highest Qp occurs when the rainfall duration equals Tc. When the rainfall duration is greater than Tc, the Qp is reduced, but the total runoff volume is increased.
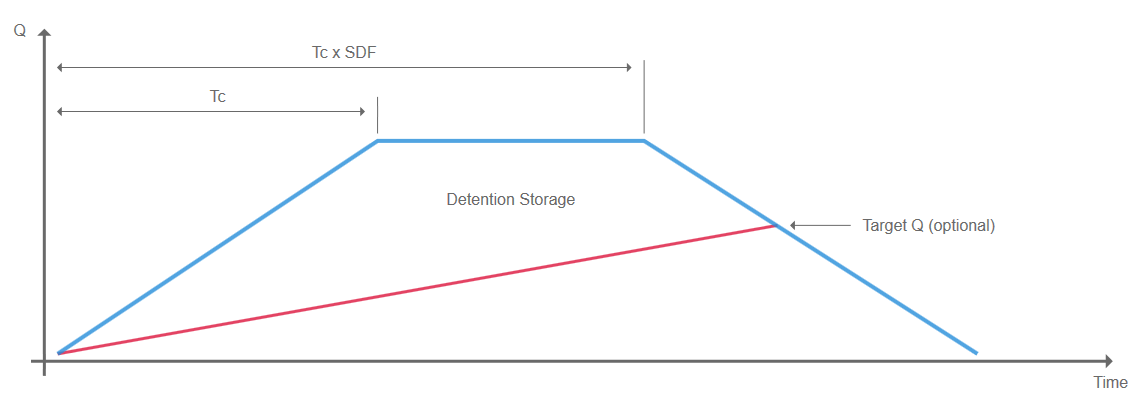
The objective is to find the total duration of Tc x SDF (critical storm event) that maximizes the required storage of a detention pond. The user simply modifies the Storm Duration Factor (SDF) between successive routings to arrive at the critical event.
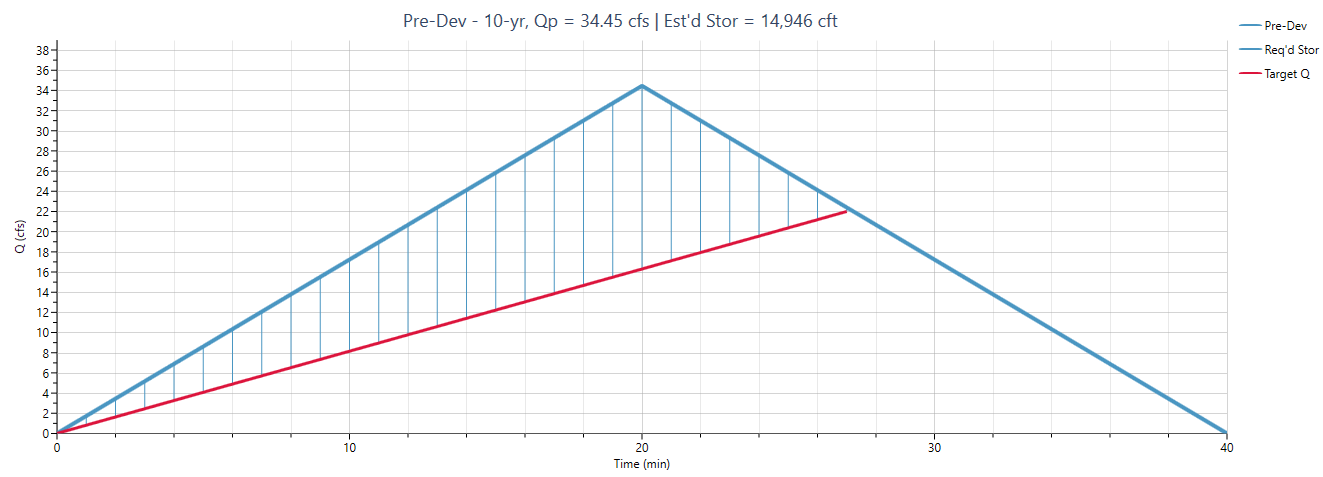
Studio Express automatically computes the critical event SDF value for you. Simply plug in the Target Q.
You can also enter a pre-defined SDF value to satisfy your local drainage authority should the need arise. In doing so, a Target Q will not be used.
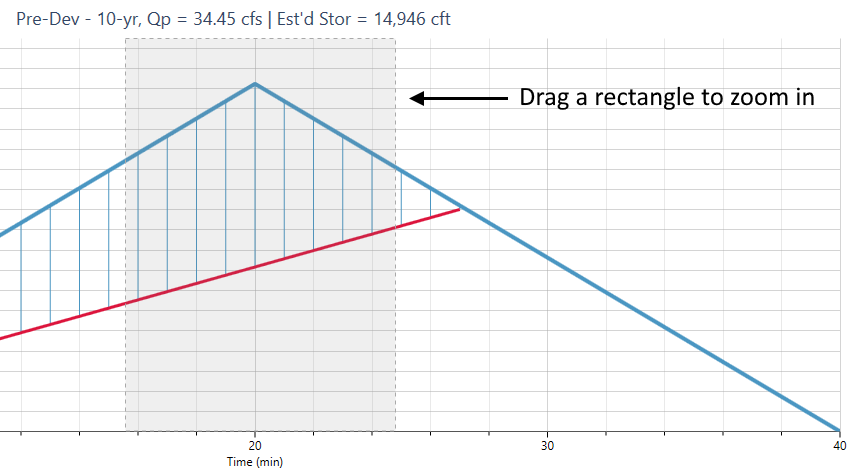
The enclosed area above the target Q line represents the estimated detention storage.
Input Requirements
The following is a description of each of the required input items.
To enter data, type in the value or select from a drop-down input box, and press [Enter] or the [Tab] key. Following is a description of those required items. Once the data is input, results are computed by clicking the [Compute] button at the bottom of the input grid.
Data is divided into four categories;
- Drainage Basin (physical characteristics)
- Rainfall (Return Period)
- Storage Estimate
- Storm Duration
Following is a description of each. While entering data for the first time, the canvas will automatically display help diagrams to assist in your data entry and the input grid will show only required data items.
Hydrograph Name
Optional but it is a recommended input as it is this label that identifies the hydrograph on the hydrographs List and reports.
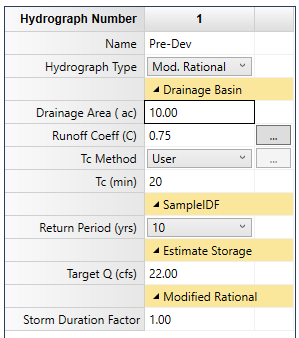
Drainage Basin
Below is a description of all inputs.
Drainage Area
Enter the sub-basin area. No size limit but watch for limits imposed by local ordinances, typically 20 acres.
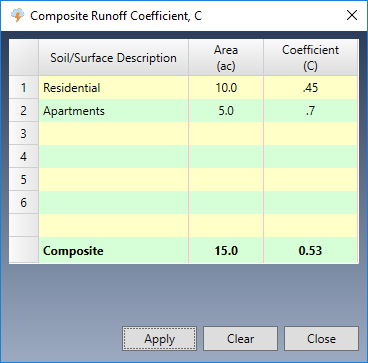
Runoff Coefficient
Enter the Runoff Coefficient for this area. A table of coefficients is available here. For a composite C, press the […] button. Up to six sub-basin areas and corresponding Cs can be entered for a composite C.
Time of Concentration, Tc
Tc is the time it takes for runoff to travel from the most remote upstream point in the drainage area to the downstream point in question. Select one of the Tc options from the drop-down list box. Tc cannot be less than the Min Tc specified in the Settings.
User – Check this option to enter Tc manually. Rational method Tc must be a whole integer.
TR55 – Compute Tc by using the built-in TR55 worksheet. See Tc by TR55.
If you chose TR55, click the ellipsis […] button to open the TR55 input screen. There, Tc will be computed and automatically inserted into the Tc input box.
Note that Lag and Kirpich methods are only applicable to NRCS hydrographs.
Rainfall
Remember that the program will use the IDF curves as set in the Rainfall Wizard. There’s no need to enter any rainfall data here.
Return Period
Select a return period from the drop-down list. Notice that it displays the name of the IDF file that is currently loaded.
Estimate Storage
This is an optional item but when entered, the software will automatically compute the critical storm duration (Storm Duration Factor) in the next data item.
Target Q
Enter a flow rate that represents an outflow, typically equal to a pre-developed site condition. This Q must be less than the computed peak Q of the hydrograph.
Storm Duration Factor (SDF)
You may enter a pre-defined SFD but if a Target Q was input, the software will automatically compute the SDF that represents the duration of a “critical” storm, overriding any inputted SDF. This critical duration is based on the assumption that you are designing a detention pond which reduces outflow down to a pre-development Target Q and one that maximizes the required storage volume.
Computing Results
Once you entered your data, click the [Compute] button at the bottom of the input grid.
Studio Express will first do a data check to make sure the inputs are okay. You’ll then be presented with the results.
You can clear the data from the input grid by using the [Clear] button.
How to Zoom a Chart
Any hydrograph plot can be zoomed by simply dragging a rectangle from the upper left to the lower right of a desired viewport. Click the Refresh button to return to full extents.