Setting up detention ponds can be difficult. In part because you can enter data but not know the outcome of the routing until the routing was actually performed. At best it’s a two-part trial & error process. The Trial Route feature brings the two parts closer by giving you the ability to add and modify outlet structures while doing the routing, in real time, dramatically reducing time spent on design.
The Trial Route function is used to perform test routings. Any time while setting up your outlets you can click the [Trial Route] button to see intermediate results. This will help you fine tune your outlet devices to match the Targets easier.
At the lower section of the Outlets Input grid you will see the Trial Route grid. It’s appearance depends on whether Step 1 – Estimate Storage was use or not.
Step 1 – Estimate Storage Feature, Not Used
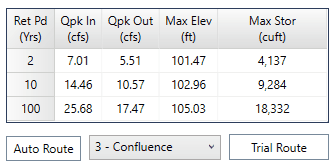
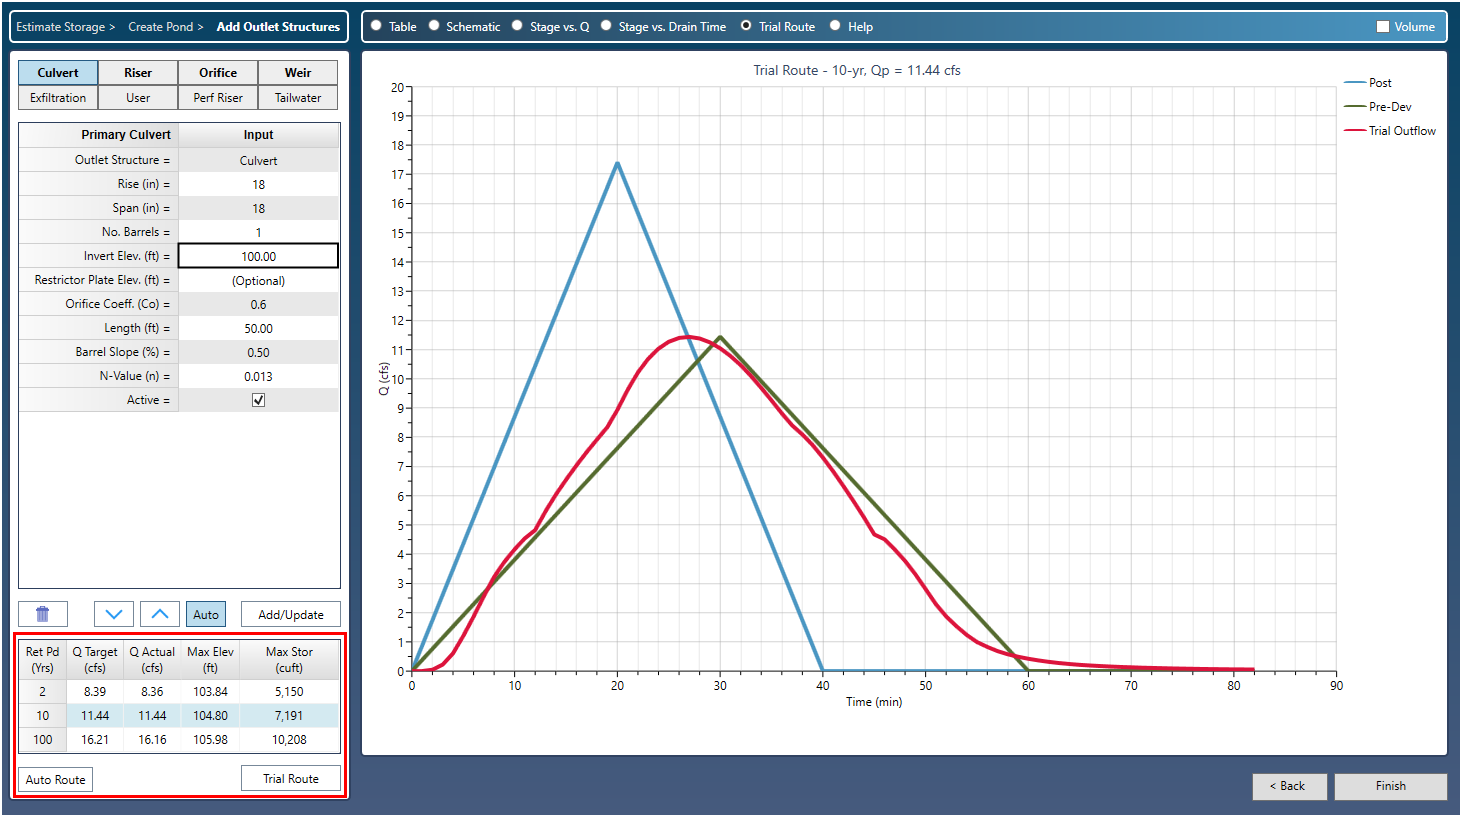
Select the Inflow Hydrograph you want to route from the drop-down list box and click the [Trial Route] button. The software will perform the routing and fill-in the grid with the results for each active return period.
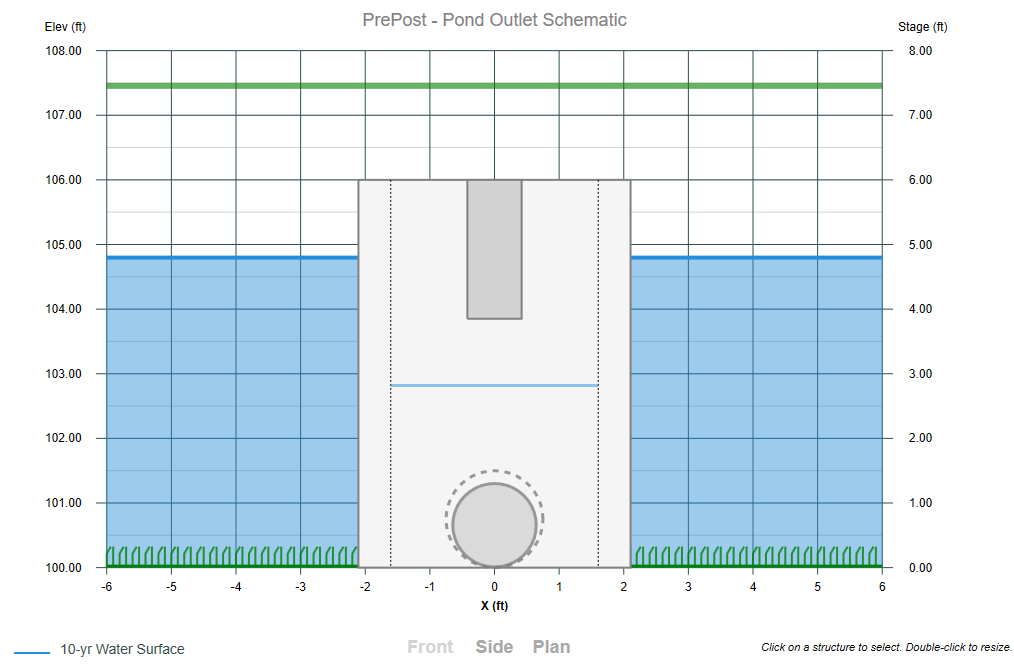
Note that this grid changes the results shown on the Schematic and the Trial Route plot by clicking on one of the grid’s rows. The grid reports the Q peak of the selected Inflow hydrograph and the Q peak of the routed hydrograph including the Maximum Elevation and Storage.
The Auto Route button allows you to automatically perform a routing after each input edit, eliminating the need to click the [Trial Route] button each time.
Step 1 – Estimate Storage Feature, Used
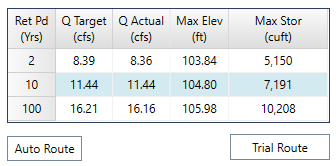
Once the storage has been estimated and your pond has been sized to match the targets generated from Step 1, you’ll notice a slight difference in the Trial Route grid. It replaces Qpk In and Qpk Out with Q Target and Q Actual respectively. There is no need to select the Inflow hydrograph as it was pre-selected in Step 1 as the Post-developed hydrograph so the drop-down list is hidden.
IMPORTANT: Even though you may have used this Trial Route feature here in the Pond Designer, you’ll need to perform the real routing back at the Main Window.
Auto Route
When the Auto Route button is toggled On, routings will be executed immediately after clicking [Add/Update]. Also note that if the Interactive [Auto] button is toggled On, you’ll see instant routings when using the Increase or Decrease buttons on the Interactive Tool.
When Trial Pond Routings Fail
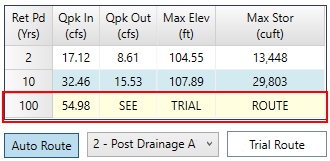
The purpose of the Trial Routing feature is to provide some insights in order to get to a solution faster and more direct. When a trial routing fails at a particular return period, the corresponding row(s) on the Trial Route table will be highlighted in yellow as shown below.
The Trial Route plot will provide a graph showing the progression of the routing, and when and where it failed. To view this graph, click on the yellow highlighted row and choose the Trial Route radio button at the top.
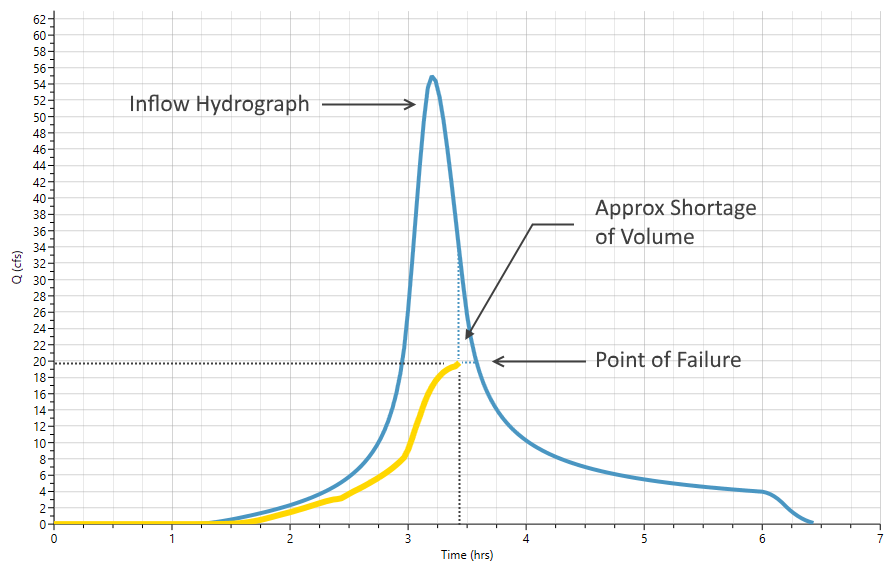 This plot shows the 100-year inflow hydrograph and the failed outflow hydrograph. In this case the routing progressed up to Time 3.45 hours at an outflow of about 20 cfs where the pond’s volume was exhausted. Any combination of additional storage volume and outflow should provide a successful routing.
As one can surmise, this routing came very close to success. If the failure point Q is close to the target Q, then just add more pond volume. If the failure point Q is less than the target Q, then first adjust the outlet devices to allow more outflow. Then add more pond volume as needed.
See also, Volumetric Detention Design and Troubleshooting Detention Ponds.