This step completes the stage – storage – discharge relationship you’ll ultimately use to route hydrographs through detention ponds. Here, you’ll specify the outlets which in turn generate discharge values corresponding to the stage values entered in the previous step.
You’ll notice in the graphic below the elevations range from 100.00 (Pond Bottom) to 110.00 (Top of Pond). These were automatically pulled from Step 2 where the pond was created.
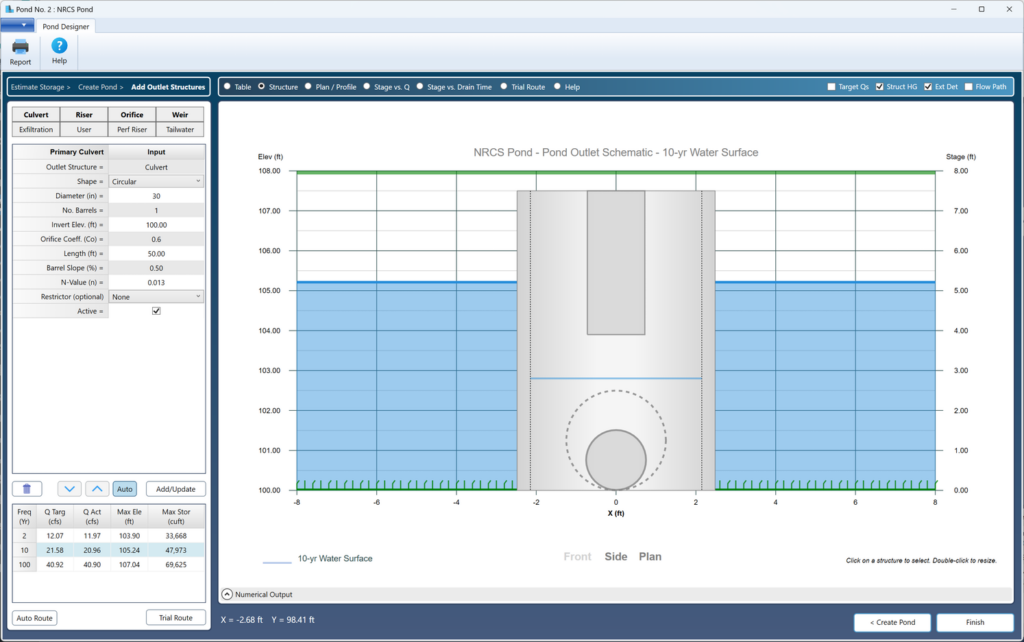
You’ll add outlet devices, one-by-one, and each will be evaluated starting from the bottom of the pond up to the “Top of Pond”. Make sure any overflow weirs (spillways) have their crest elevations set below the “Top of Pond” or they will be missed during the stage-discharge calculations.
To add a device, first select one from the array of buttons at the upper left. (More about this later). This will setup the corresponding input grid for that device. For example, to add a culvert, click the Culvert button. Then fill in the input grid below it. Click [Add/Update] when done. Repeat for additional devices.
It is highly recommended to follow the procedures described throughout this documentation as well as later in this article. That is, add devices starting from downstream, working upstream.
 Hydrology Studio has several unique outlet structures to choose from. They can be set up as independent structures and/or put in series for multi-stage configurations.
Outlet Structure Options
Below are descriptions of each type of outlet device you can add to your pond. But please click the Help radio button to see diagrams of each structure which will help in your data entries.

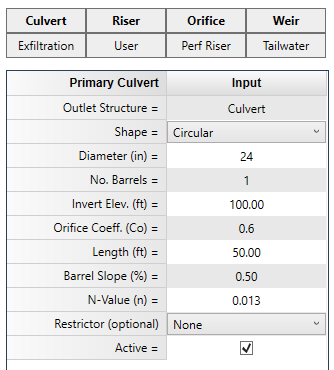
Primary Culvert
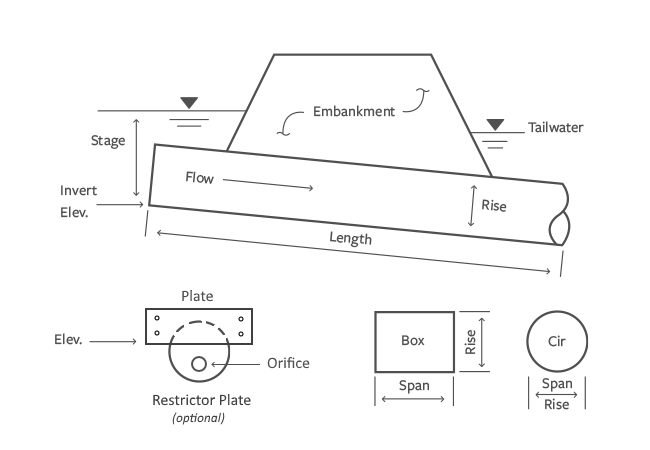
Can be circular, rectangular or elliptical with multiple barrels and may include a restrictor plate.
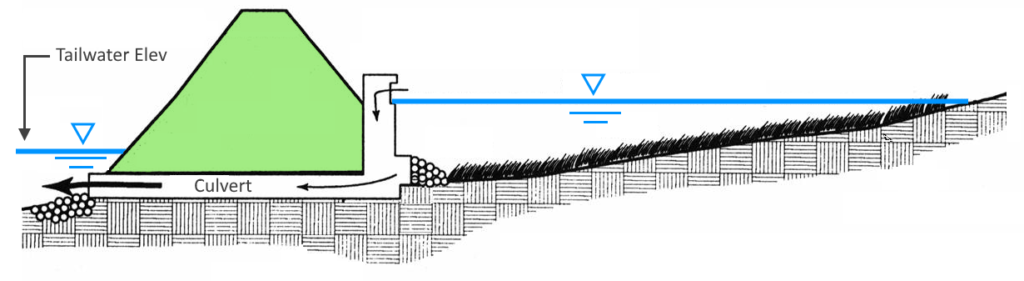
Ensure that the slope of the Culvert is always greater than or equal to zero. Negative slopes are not allowed. In case you need to represent the Culvert with a negative slope, include a Tailwater elevation that matches the downstream end of the Culvert.
Restrictor plates can be a rectangular plate at a specified position (invert) from the Culvert’s invert or a circular orifice with any diameter that is less than the culvert’s Rise.
If You Have Multiple Culverts
A given pond can have only one primar culvert. If you need to model more than one culvert, enter the information for one of them. Then copy & paste its computed Stage-Discharge results from the Output Table into the User device. Then modify the original Culvert data, i.e., slope, size, inverts, etc. to represent the second culvert. See User Defined below for instructions.
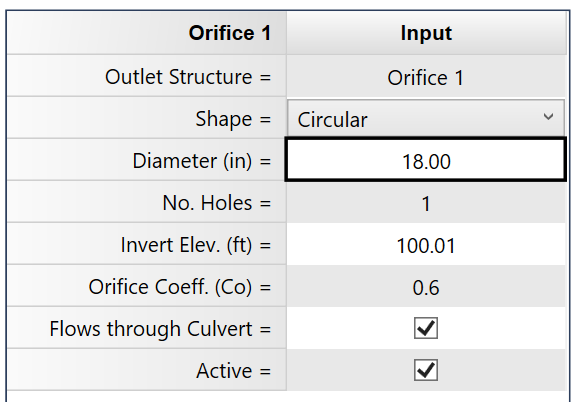
Orifice
Up to three, circular or rectangular. Can flow through the Primary Culvert (typical) or act independently. See Riser Structure below.
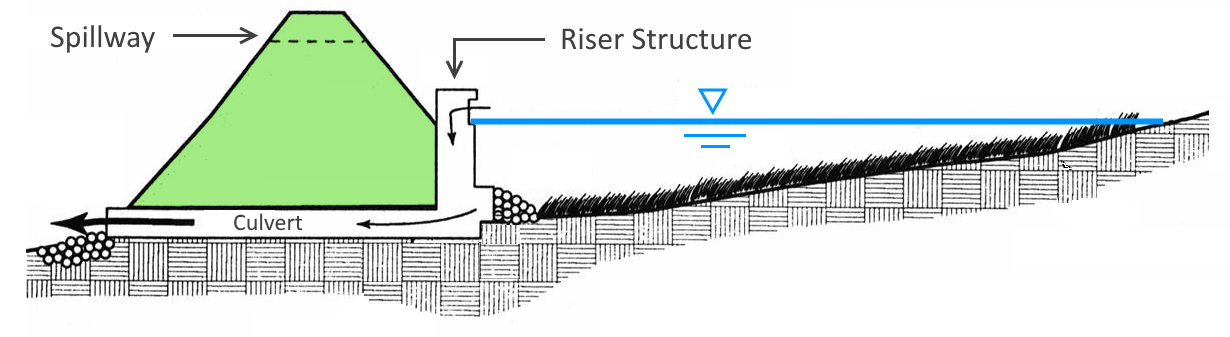
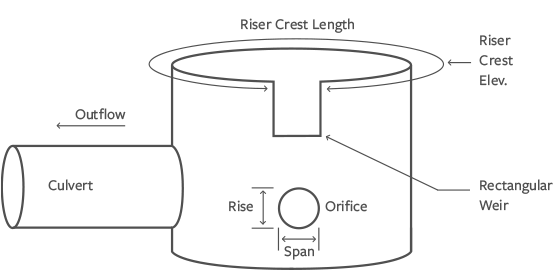
Riser Structure
Used for multi-stage structures. Can act like a weir. Can be circular, rectangular (box) or sloped. Is assumed to be connected to the Primary Culvert at its upstream end.
If you’re modeling a Riser that has a grate on top, use the Sloped shape and set the upper and lower elevations the same so that it’s flat on top. The software automatically takes into account the grate during calculations so you will not need to make any adjustments for bar widths. Please see Computational Methods for more information on sloped risers.
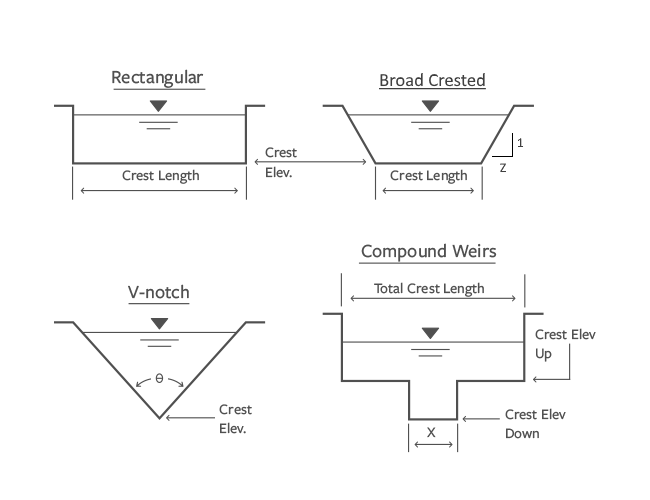
Weir
Up to three. Can be Rectangular, Cipolletti, V-notch, Broad Crested w/ side slopes or Compound. Can flow through the Primary Culvert or act independently as a spillway.
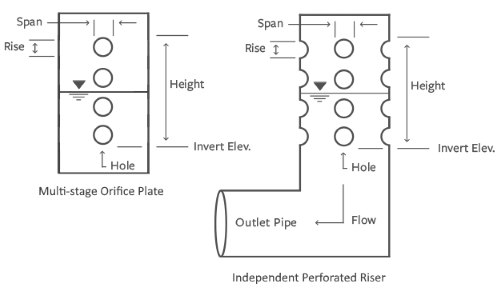
Perforated Riser
A stand-alone riser with perforations. Converts to an orifice plate when a Riser is present. Not to be confused as a restrictor plate for the culvert.
Exfiltration
A.K.A. Infiltration. Water exiting the pond as a rate which is applied to the pond’s contour area at each stage or elevation. All exfiltration is assumed to be downward. Can automatically be extracted from routed outflow hydrograph. Please note that Exfiltration can only be applied to ponds defined as Contours, Trapezoidal or UG Chambers with encasements. Does not apply to Manual storages because there are no contour areas for the rate to apply to.

Enter the exfiltartion rate in inches/hour (mm/hour). If you only have a measured percolation rate, (P), in minutes/inch (minutes/mm) the exfiltration rate equals 60/P.
Note: Use Studio Express Groundwater for retention pond recovery time analysis for both unsaturated and saturated flows in shallow, sandy aquifers.
User Defined Flows
Input known discharges at each stage increment directly. This feature is particularly beneficial in scenarios where a Stage vs. Q curve has been previously established, either externally or within Hydrology Studio, especially when modeling multiple primary structures.
This tool can also import discharges from any other outlet device, such as flows from the Primary Culvert. To do this, select any cell in the Output Table corresponding to the desired device column, right-click, and choose ‘Copy discharge data to User’. This action will transfer the data from that device to the User device while keeping the original device data intact.
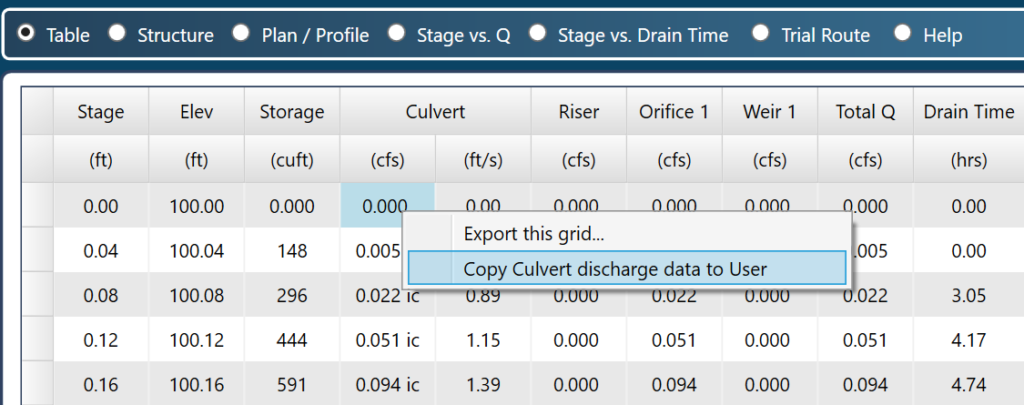
Note that you can copy discharge data from any device displayed on the Table, including the Total Q. The Total Q could be that from a multi-stage structure, i.e. (Riser, Orifices, etc.) So effectively, you can model two distinct multi-stage structures in a pond.
For example, you can model multiple primary Culverts while Hydrology Studio allows for only a single primary culvert. Simply add one Culvert. Then copy its data to User as described herein. Then replace the original Primary Culvert with new culvert data.
User can also be useful for utilizing a pump as a discharge device. Just add the pump’s outflow from its Head vs. Q performance curve into this table. The Head varies as the Stage of the outflow point minus the Stage in the pond. Thus the Head will decrease with increasing Stage, increasing the pump’s discharge. Therefore the discharge values in this table should increase with increasing Stage.
Tailwater
Doesn’t contribute to, but can affect, outflow. A single tailwater elevation be selected from the drop-down list box while designing the Pond. These selections correspond to each of the Stage points in the Table. To increase the precision or to provide more points in the list, please provide more points in the Stage-Storage.
Note that this tailwater elevation does not carry over to the final pond routing back at the Basin Model on the Main Window. You will have an opportunity there to specify unique tailwater elevations for each active return period.
In computing the outflows, Hydrology Studio treats the discharges from these outlet structures as a function of stage or water surface elevation. Partial and full flow conditions are computed as well as inlet and outlet control, and submergence.
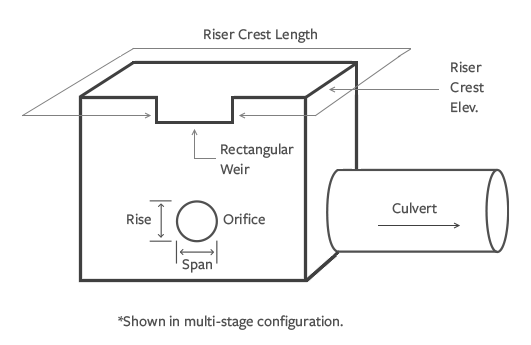
About Multi-Stage Configurations
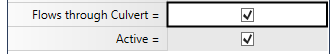
Unless the multi-stage option ( “Flows through Culvert”) is checked On, each outlet structure is treated independently. The multi-stage option puts the structure(s) in series directing the outflows from that device to flow through the Primary Culvert.
The structure with the least capacity at any given stage will control the final outflow. The Culvert is always the final outflow device so it does not have a multi-stage option. Additionally, Riser structures are automatically set to be a multi-stage device as they are assumed to be connected to the Culvert.
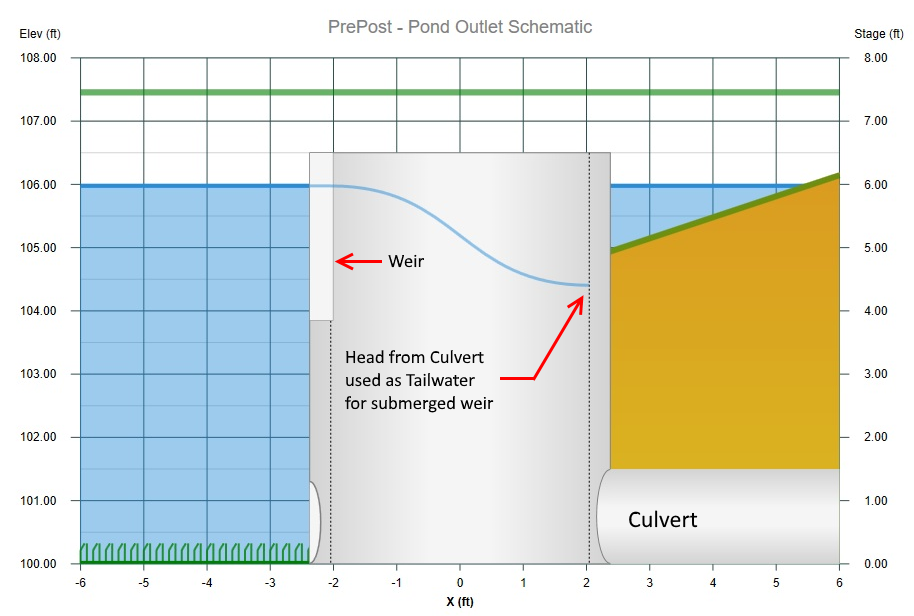
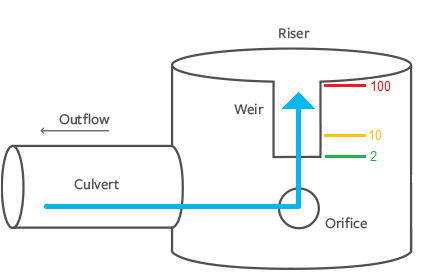
The structure shown below contains a Culvert with a Riser, an Orifice and a secondary Weir. The Weir and Circular Orifice (Rise and Span are the same) are set as multi-stage (“Flows through Culvert”).
When using the Multi-Stage option, Hydrology Studio checks the head elevation produced by the Culvert. This head is then used as a tailwater elevation against other multi-stage devices. As this head increases, the outflows from the orifice(s) and weir(s) decrease. When this head equals the current stage, the Culvert becomes the controlling structure and contributing flows from the orifice(s) and weir(s) diminish.
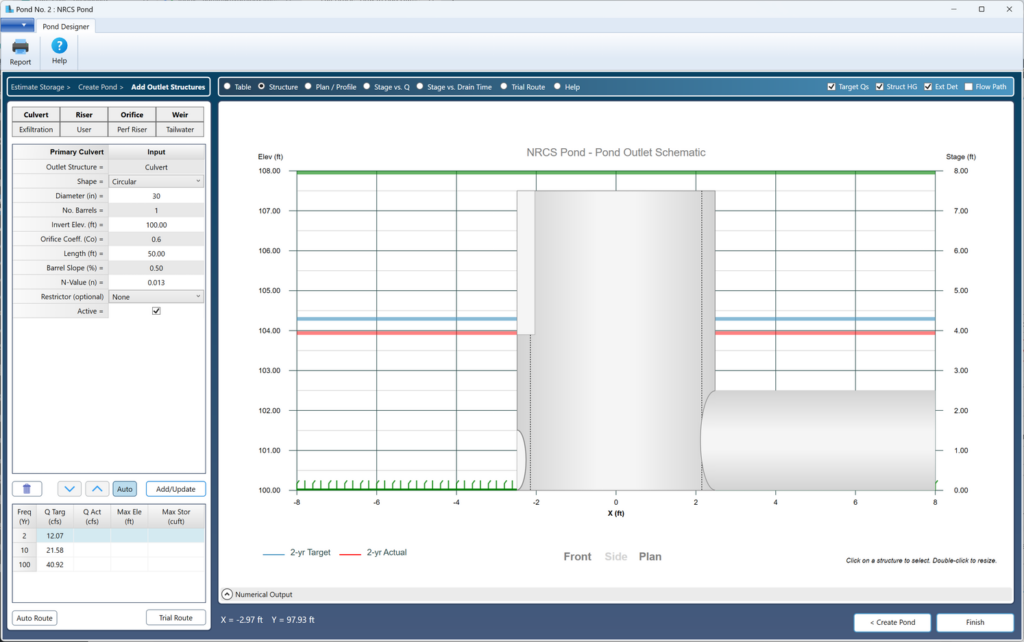
Adding Outlet Devices to Your Pond
You may add any combination of outlet devices to your pond. You can add up to three weirs, three multi-holed orifices and other devices in a single pond. Outlet devices can be added in any order you wish but we recommend adding them starting from the most downstream device and working upstream.
To add a device, click on the button corresponding to the device. For example, click the Culvert button to add a culvert. Then add the required data, and click the [Add/Update] button. Once added, the header or device name will be shown in bold. For example, a Culvert, Riser, Orifice and a Weir have been added to a pond as shown in the screen below. Notice their header labels are in bold.
The output table, schematic structure and charts on the right will be updated with the new stage-discharge data. To see diagrams of each of these devices, click on the Help option button.
You can deactivate any structure by turning Off the Active check box. This preserves the structure’s input data but removes it from the stage-discharge calculations. Useful for performing “What-if” scenarios.
Viewing the Stage – Discharge Results
After adding your devices, you will be able to view the results in a variety of ways by selecting a radio button at the top of the Canvas.

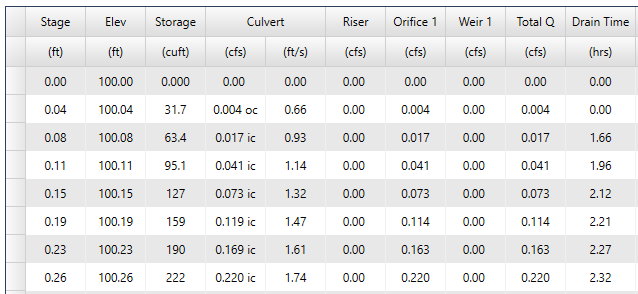
Table
The Table displays the Stage-Discharge results in a numeric format. Each Stage increment from Step 2, where you added your pond’s physical data, is divided into 10 intermediate increments for more detail. The outflows from each structure are shown in their individual columns. The Total Q is the sum of the individual structures. If, however, the secondary devices are multi-stage, then the Total Q will be either their sum total or the flow from the Primary Culvert, whichever is in control.
The Drain Time indicates the time it takes to drain the pond from the corresponding elevation in the pond down to empty (Stage zero).
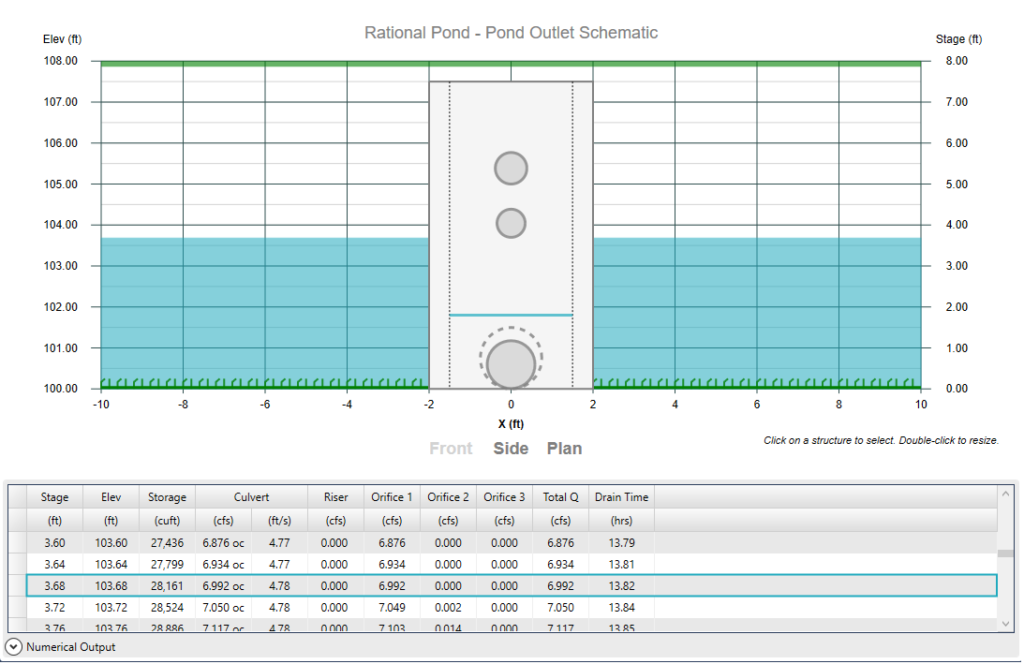
Structure Chart
Hydrology Studio offers the capability to generate a semi-schematic detailed illustration of your structure(s) for enhanced visualization of the final design. The schematic can be viewed in Front, Side, and Plan views by selecting the links located at the bottom of the image. This interactive feature allows you to click (or double-click) on any element to make edits.
Furthermore, you have the option to click on the Expander at the bottom to display a table showing numerical results. By clicking on any row in the table, you can plot the corresponding water surface.
Export the Structure to an image file
Save this drawing to an image file by right-clicking on it and selecting, “Export this chart..”.
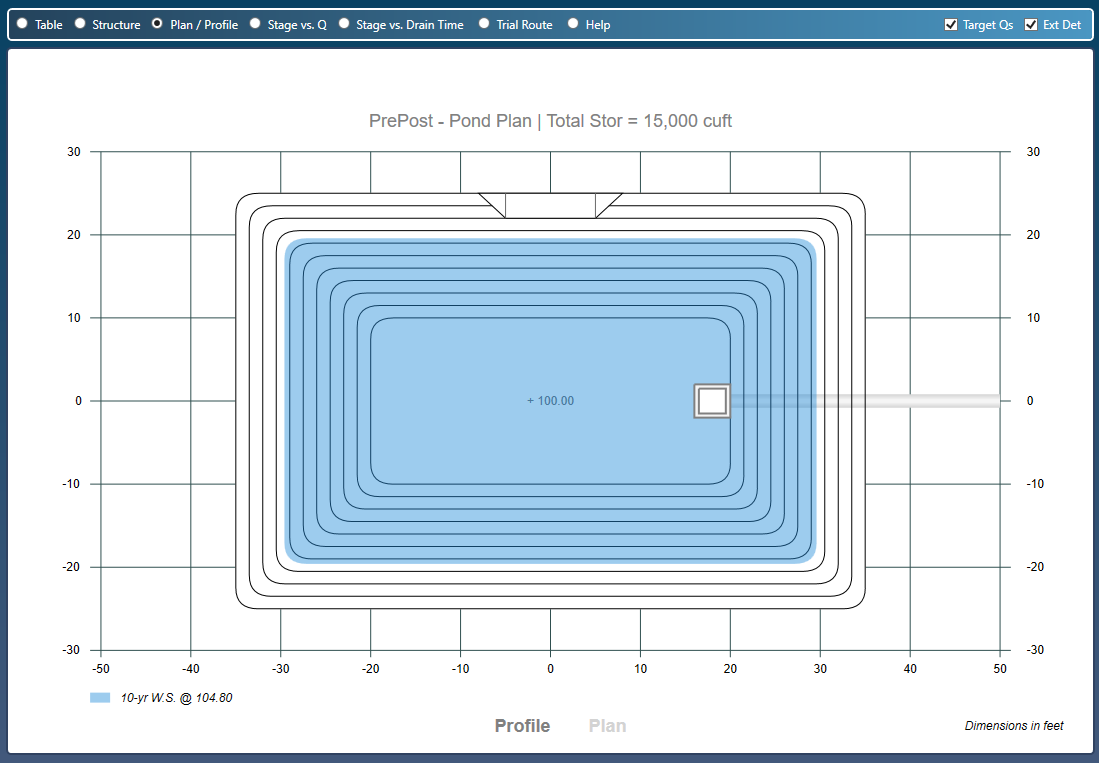
Plan / Profile Drawings
This option will draw your entire detention pond including the outlet structures in Plan and Profile views. For the pond’s contours, it draws from the input data used back in Step 2 – Create Pond.
Note that this plot is fully interactive in that you can click on a device to edit it. This drawing is also available back at the main window on the Charts tab.
Stage-Discharge Chart
It is highly recommended you view and understand the Stage-Discharge plot before proceding to a routing. Make sure it is exhibiting the behavior you expect.
You can view your outlet data at any time by selecting the Stage vs. Q option button on the top of the output table. The outflows from the individual structures can be toggled on or off as well as the Structure HG, Total Q and Target Qs. The Stage-Discharge chart below shows this multi-stage device with all structures turned On.
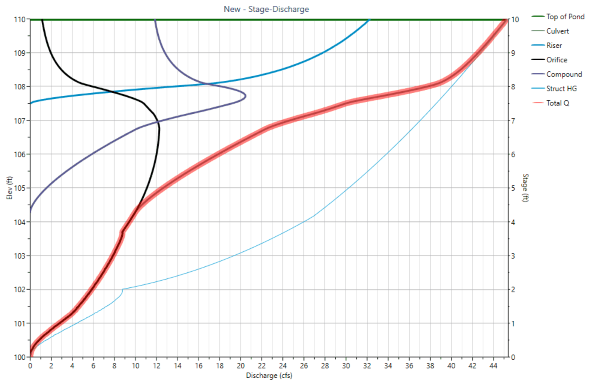
When using the multi-stage option, Hydrology Studio checks the head elevation produced by the Culvert. This head is then used as a tailwater elevation against other multi-stage devices. As this head increases, the outflows from the orifice(s) and weir(s) decrease. When this head equals the current stage, the Culvert becomes the controlling structure and contributing flows from the orifice’s and weirs diminish. The chart above explains this in graphic detail.
Notice how the flows from the Orifice and Compound Weir diminish around elevation 107.5. This indicates that the Riser is filling up due to backwater head produced by the Culvert. The light blue line is the Structure HG and indicates the depth of water inside of the Riser. When this line merges with the Total Q line, the Culvert is the controlling structure. This occurs at approximately elevation 108.
Learn more about these charts by reading this blog post : Chart Tales, The stage-discharge curve explained
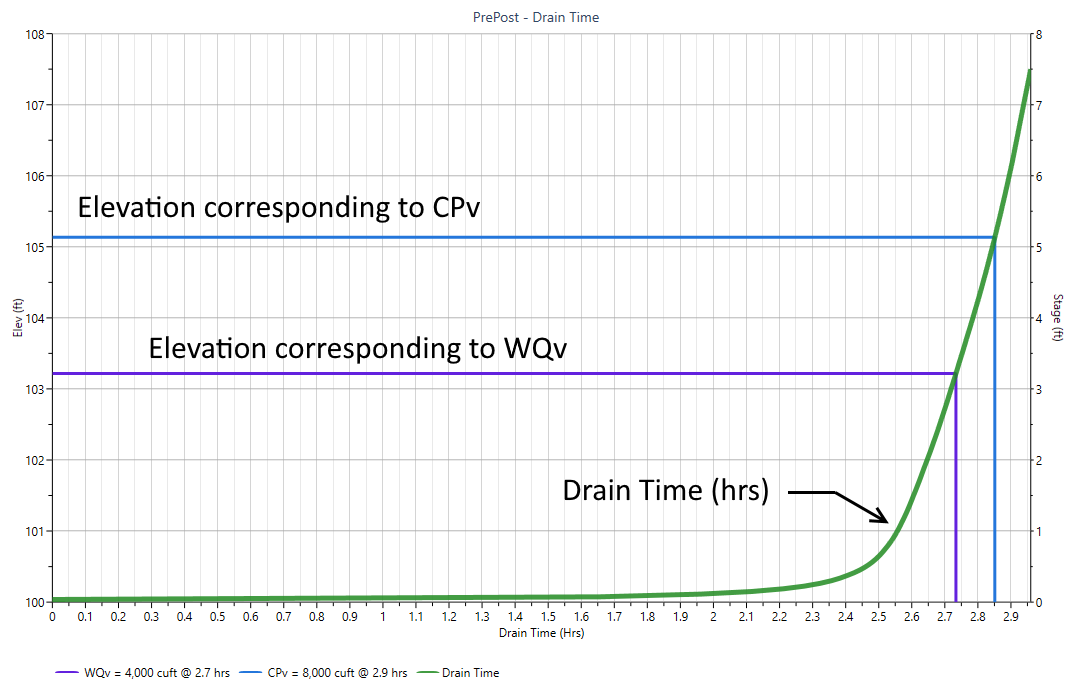
Stage vs. Drain Time Chart
This chart provides an excellent visual guide of your pond’s drain time. The drain time is the time it takes for the pond to completely empty itself from a given elevation. The chart below shows the Full Spectrum volumes inputted at Step 1. In the chart below, it takes 2.8 to 2.9 hours for the Channel Protection Volume (CPv) to drain out. Your goal is to make adjustments to your outlet devices until the desired drain time is achieved.
Editing Outlet Devices
Edit any existing outlet device by selecting it from the Outlet Device Selector. Alternatively, click on the device shown on the Schematic plot. You can permanently remove any device by selecting it and clicking the [Trash] button.
Using the Interactive Tool
This method is highly effective in refining your outlet structures and achieving a final design in a timely manner. The tool is equipped with buttons, as displayed below, which enable you to easily edit most of the input items without the need for manual typing or re-typing of values. By selecting the [Auto] button, any edits made will be automatically applied.
Here’s how it operates: Simply place your cursor on any input item, such as the Orifice Diameter, and then click on either the [Arrow Up] or [Arrow Down] buttons. This action will either increase or decrease the Orifice Diameter or Rise. You will immediately observe the results on your output table, schematic, and stage-discharge curve.
The standard increment is usually 0.01 ft. Pressing the [Shift] key will raise the increment to 0.1 ft. Pressing the [Ctrl] key will set the increment to 1.
Note that Culvert sizes will be automatically selected from commercially available options. Some inputs cannot be adjusted using the Interactive Tool, such as Culvert Length or Weir Coefficients. In such cases, the Interactive Tool will appear disabled
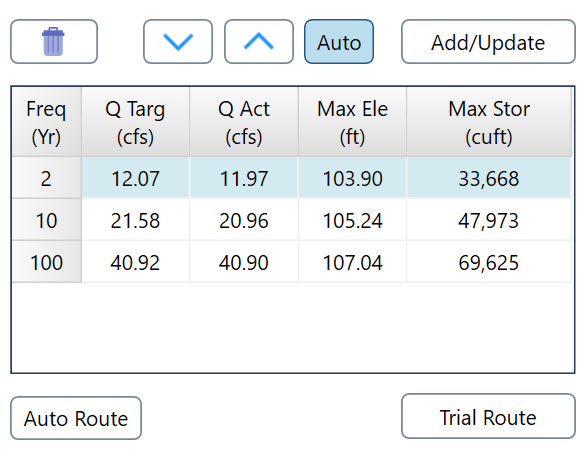
Auto Route
This feature seamlessly integrates with the aforementioned “Auto editing” function. With the [Auto Route] enabled, not only will the edits be automatically applied, but the software will also execute a routing process. The outcome of this routing will be showcased on the Trial Route Results table.