This design method basically follows the same procedure as Design Using the Structure Schematic Chart. Instead this method relies on the Stage-Discharge chart.
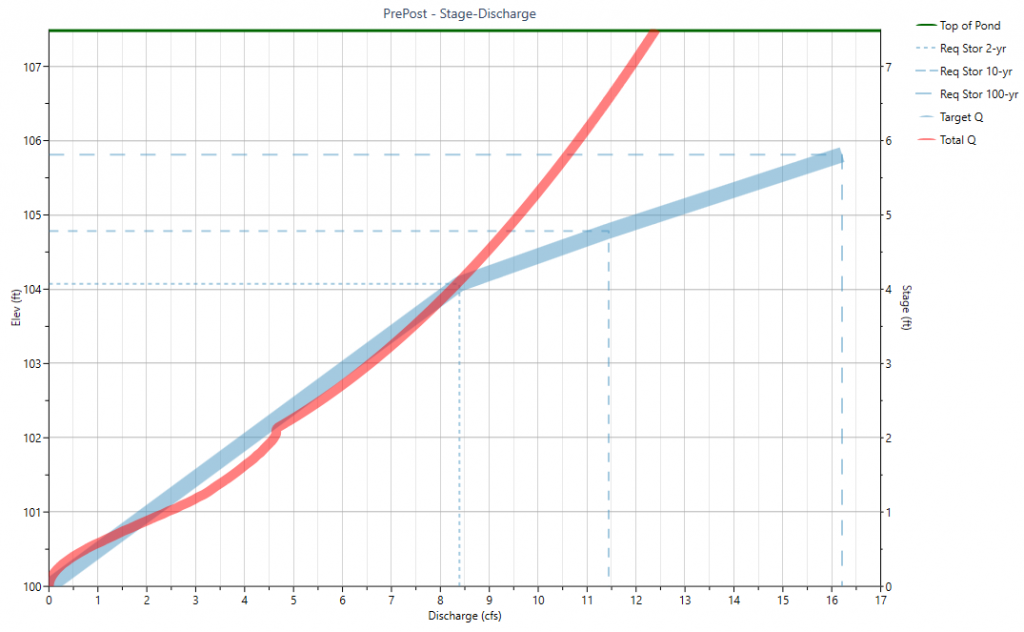
Once you have completed Steps 1 and 2, and have moved to Step 3, the software automatically develops a Target Stage Discharge curve for you to use as a guide in selecting your outlet devices. This curve appears on the Stage vs. Q chart as a thickened line as shown below.
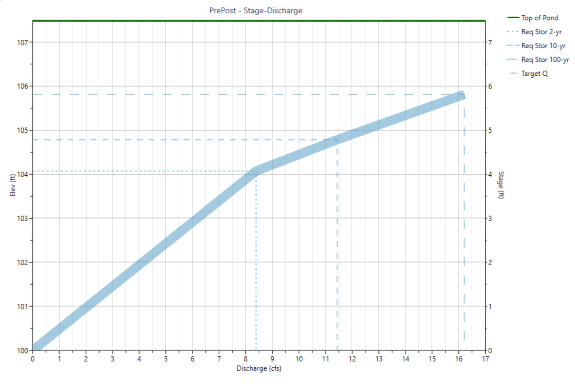
This heavy blue line is our Target Stage-Discharge. The dotted lines represent the elevations corresponding to the Target Qs. We simply need to create an outlet structure to match this.
By adding and setting up outlet devices, we can create an “Actual” Stage-Discharge curve which matches this Target curve. That’s our goal here.
By adding and setting up outlet devices, we can create an “Actual” Stage-Discharge curve which matches this Target curve. That’s our goal here.
Once matched, your design is basically completed. This can be accomplished by selecting outlet structures, one-by-one, and making adjustments until the actual Stage-Discharge curve matches the target. You’ll use the Trial Route function to perform pre-routings to finalize your design.
An Example
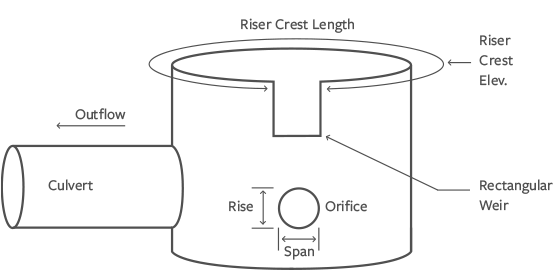
The curve above was derived from a Pre- and Post Development Model. Steps 1 and 2 have already been completed. Target Qs of 8.4, 11.44 and 16.21 for the 2, 10 and 100 year return periods were established respectively. We’ll use a multi-stage structure similar to that shown below and begin adding devices working from the downstream-up.
Step 1 – Add and Size the Culvert
We’re going to add a 15-inch culvert and set the slope to 0.5% and the length to 25 feet. Then click [Add/Update].
As you can see, the maximum flow produced by the 15-inch at our Target elevation of 1005.75 +/- is insufficient at about 13 cfs. We increased the size to 18-inches to produce the following.
This exceeds the Target Q of 16.21 by about 2 cfs. (Where the Total Q crosses 1005.75 line.) Since we are limited to commercially available pipe sizes, we’ll need to keep the 18-inch and use a secondary device to control the upper, 100-year frequency.
Step 2 – Add and Size Orifice
An educated guess adds a 15-inch orifice at elevation 1000.01. We will be sure to check “Flows through Culvert” On. Then click [Add/Update].
The 15-inch orifice looks to be a good fit as it follows the Target line up to Stage 4.0. Also note that the Total Q line only reflects what is flowing through the Orifice because it is multi-stage. The Culvert is now limited to the Orifice flows.
Step 3 – Add Secondary Weir
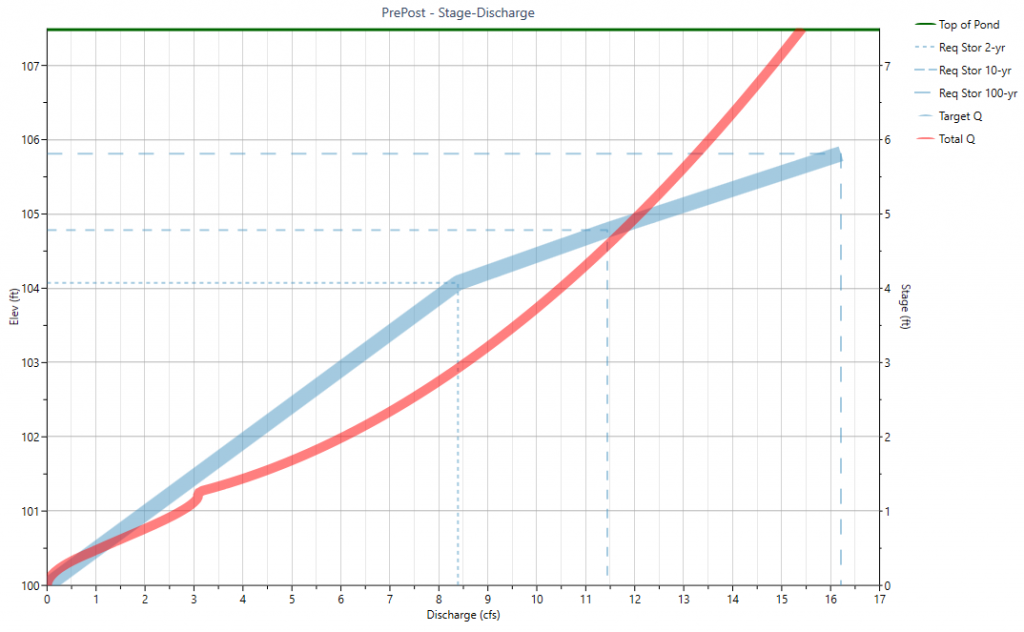
Now we’ll add a rectangular weir with a crest elevation approximately equal to the 2-year Max. Elev. of 1004.00. We’ll try a “Best guess” crest length of 1.0. Not to forget to check “Flows through Culvert” On. Click [Add/Update].
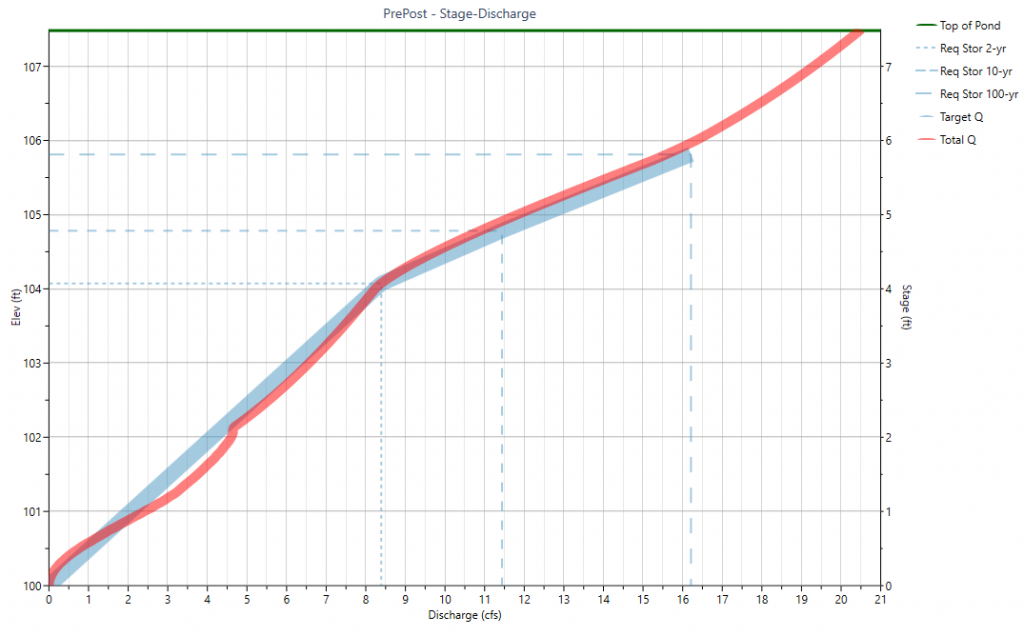
The Total Q follows the Target Q line and the trial routing assures us the Target Qs are met. What’s more is that the secondary rectangular weir appears to satisfy both 10- and 100-year events!
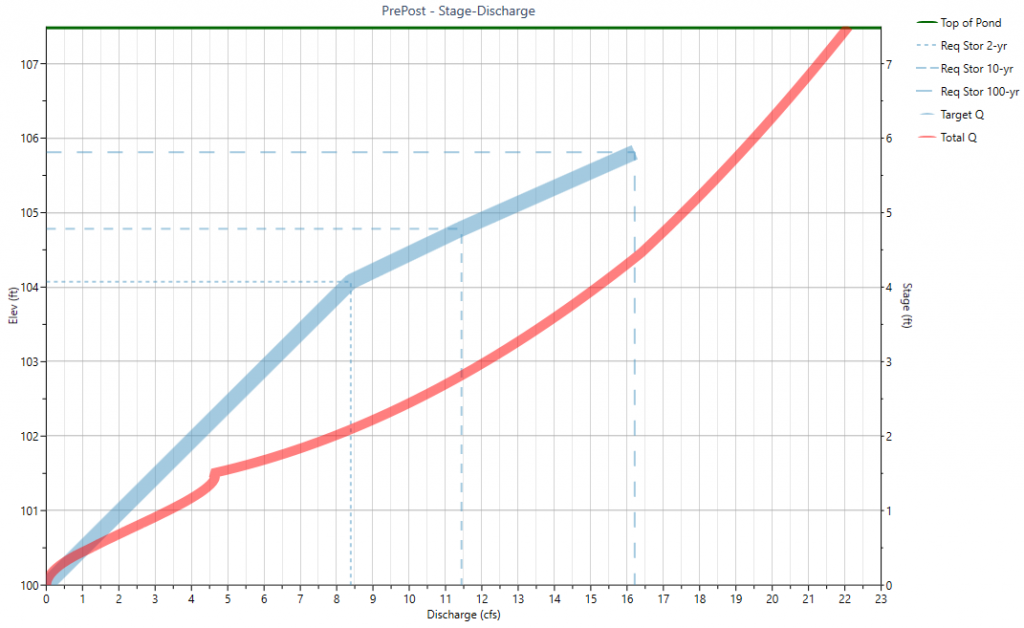
Step 4 – Add Riser Structure
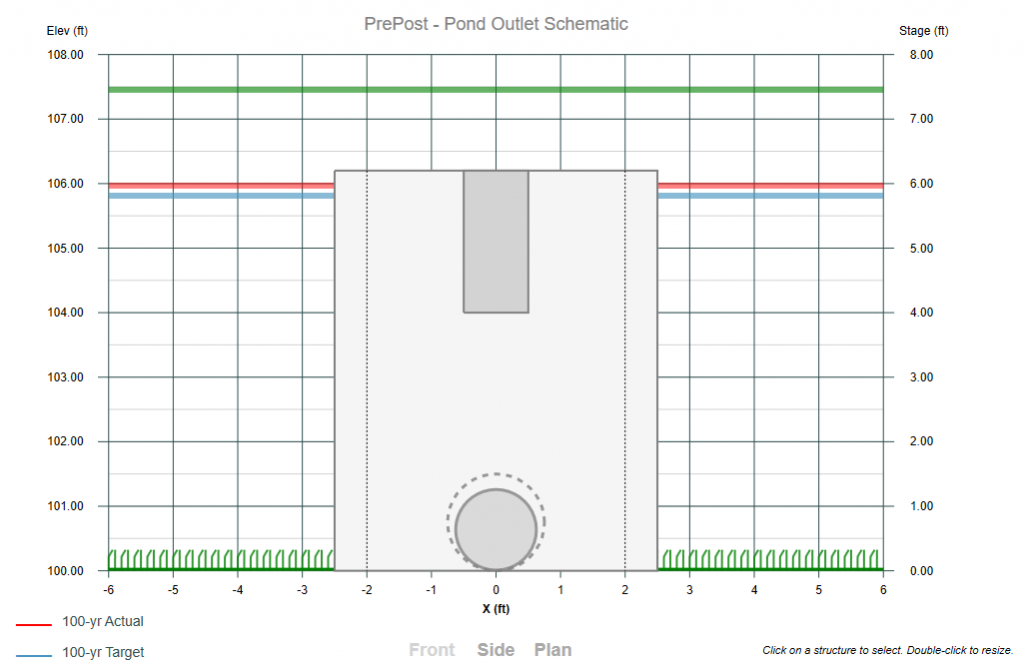
We want to set the crest elevation just above the 100-year Target, say 1006.00. Since we don’t want the riser structure to control or contribute to flows, we want to make sure that its crest length is large enough to avoid this. A “best guess” is 4 ft on each side, say 16 ft Box. But subtract 1 ft due to the inserted weir and enter 15. Click [Add/Update]. We shouldn’t see any changes in the Total Q line. The Riser crest length can be adjusted down if desired.
Preliminary Design Complete!
That’s all there is to it. Our preliminary design is complete. We designed all three devices starting from the culvert and working through each return period designing the orifice and weir. All we need to do now is confirm and, if needed, fine tune our outlet sizes to where all of the Actual Qs are near or below the Target Qs.
But first, we’ll take a look at the schematic by selecting the Structure option button on top of the output table. It looks like this:
Step 5 – Finalize Design
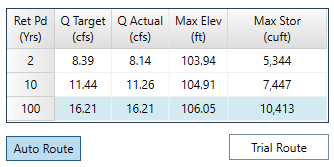
Now we need to see how our new design reacts to an actual routing. We simply click [Trial Route] and compare the Q Targets with the Q Actual.
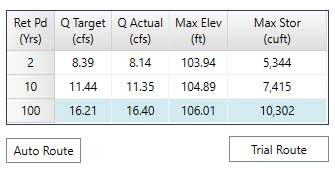
The results are nearly perfect!
The 100-year Actual Q is above its target by 0.19 cfs so we will need to fine tune. If the [Auto Route] button on the Trial Route grid is toggled On the software will automatically perform the routing while adjusting.
We adjusted the Riser Crest Elevation upwards to 106.10 and the Secondary Weir Crest Length from 1.00 ft down to 0.92 ft and the Riser Crest Length to 16.00 – 0.92 = 15.08 to produce the following results.
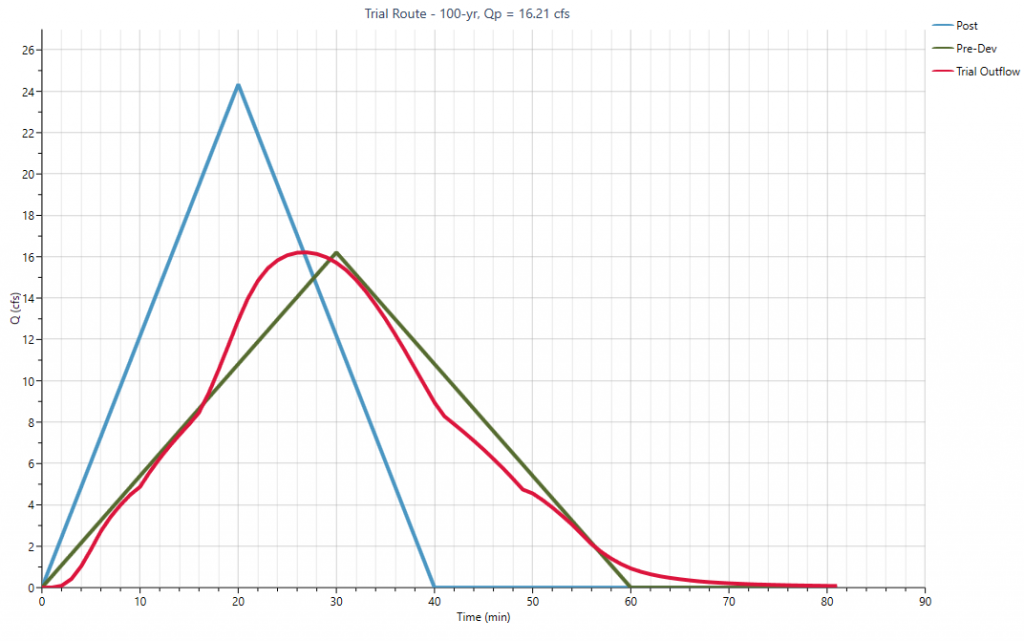
Below is a plot of the Pre- and Post-developed hydrographs as well as the Trial routed hydrograph.
Conclusion
Hopefully this example has inspired you to try this on each and every pond design. It’s simple, direct, fast and requires minimal guesswork and messy iterations. Work from the downstream upward and design each structure as you go using the Target Q elevation lines. Set your inverts equal to the lower frequency elevations and use the Interactive tool to adjust the sizes to where the Actual “approximately” matches the Target. Use the Trial Route feature to fine tune.