Once you have completed Steps 1 and 2 and have moved to Step 3, the software automatically develops target elevations that correspond to the Target Qs. These elevations can be overlayed on the Schematic (Structure) chart by checking On the Target Qs check box at the top of the chart screen.
The software adds a horizontal line across the chart that corresponds to elevations at the Target Qs. After adding some outlet devices, a second line will be added that corresponds to the Actual elevation produced by the outlet structure.
The goal is to add and adjust outlet devices so that both lines coincide at each frequency. Once this is done, your design is basically complete.
The goal is to add and adjust outlet devices so that both lines coincide at each frequency. Once this is done, your design is basically complete. You’ll use the Trial Route function to perform pre-routings to fine tune and finalize your design.
An Example
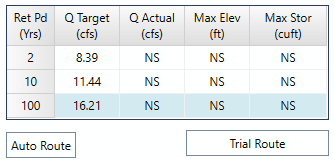
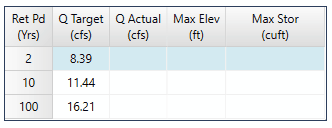
Let’s assume Steps 1 and 2 have been completed and your Target Qs of 8.4, 11.44 and 16.21 for the 2, 10 and 100 year return periods were established respectively.
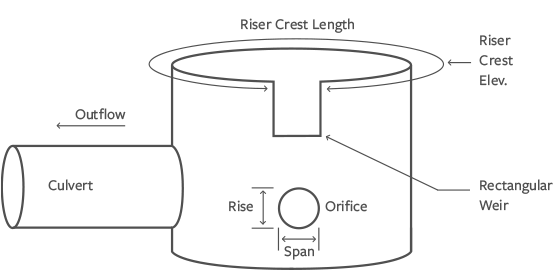
This example uses the multi-stage structure similar to that shown below and begins adding devices working from the downstream-up. This means we start with the highest target Q and frequency, 100 year, which is controlled by the Culvert, the most downstream device.
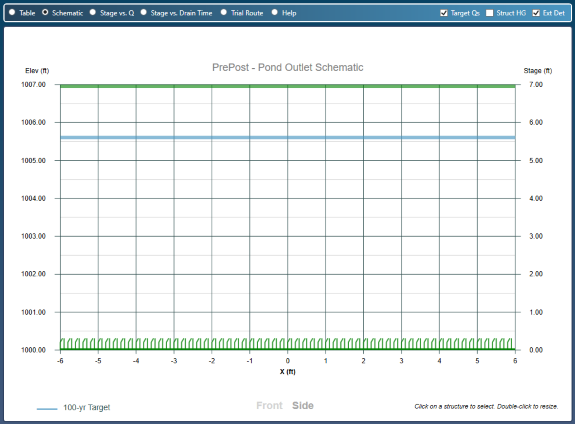
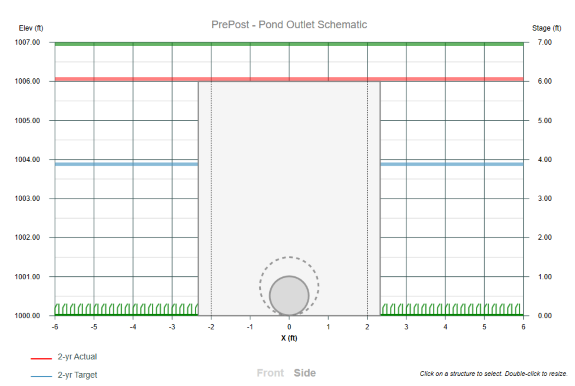
When we initially begin Step 3 – Add Outlets, we should click on the Structure (labeled as Schematic in versions prior to 2.0.0.50) radio button to see the following chart which shows the top and bottom of our pond. No structures have been added yet. Next, we will click on the row in the Trial Route table that corresponds to the 100-year return period.
Step 1 – Add and Size the Culvert
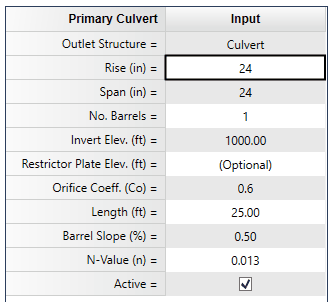
Because we work in the upstream direction, we’ll add a 24-inch (randomly chosen) Culvert and set the slope to 0.5% and the length to 25 feet. Click [Add/Update].
The Schematic chart will update showing the newly added culvert, and add the Actual line corresponding to the culvert.
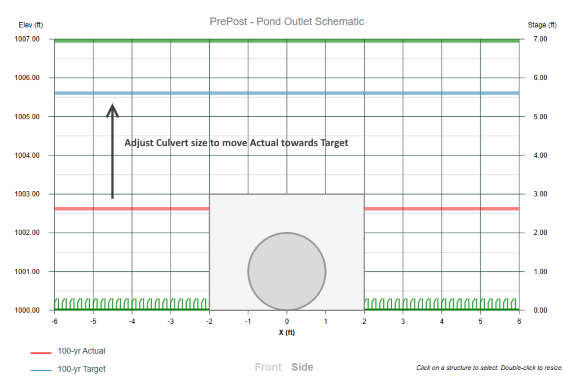
Notice the Actual line is below the Target line. In other words, the head produced by the culvert is below the Target elevation. We need to reduce the size of the culvert thereby raising the headwater elevation towards the Target line.
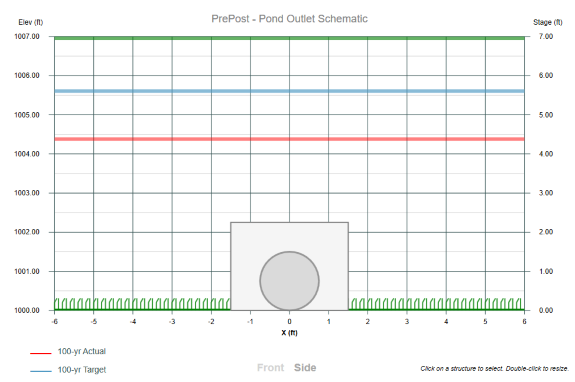
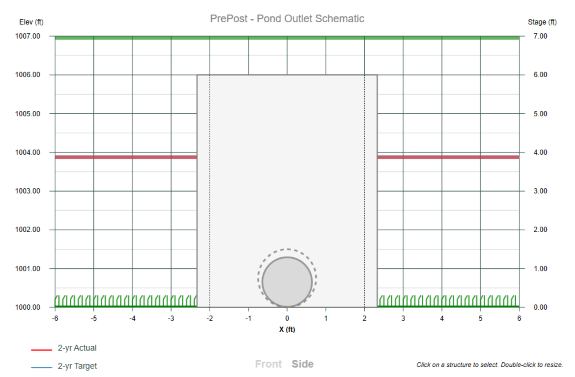
To do this, we select the Culvert Rise on the input grid and click on the [Down Arrow] button on the Interactive Tool. The size will reduce to a 21-inch. The Actual line goes up. We click again to lower the size to an 18-inch. The Actual line moves even closer to the Target as shown below.
Reducing the culvert size even further to a 15-inch caused the Actual line to rise above the top of the pond and disappear. Remember, this line represents the head (includes entrance losses) produced by the 100-year Target Q. In this case of 16.21 cfs.
The 15 is too small so we will need to accept the 18-inch size, even though it is not perfectly coinciding with the Target. This is typical when being limited to commercially available pipe sizes. The 100-year event will need to be controlled by our secondary devices.
Tip: If your site conditions permit, you can consider lowering the Target line by going back to Step 2 and enlarging the pond size.
Step 2 – Add the Riser Structure
Since we know we will be employing secondary devices to manage the target outflows, we’ll need to add a Riser to contain these devices. We’ll click on the Riser structure selector and enter the following for a 4 x 4 box with a crest elevation slightly above the 100-year target, say, 1006.

Step 3 – Add the Orifice
We work from downstream to upstream so the orifice is our next device. First, we will click on the 2-year return period row on the Trial Route table. This will change the Target and Actual lines on the Schematic from the 100-year to the 2-year event.
We’ll click on the Orifice selector and choose Orifice 1. Then enter the following (12-inch randomly chosen):

Our Schematic chart will look now like this:
Our objective now is to adjust the size of the orifice so that both red and blue lines match. We will select the orifice Rise on the input grid and click on the [Up Arrow] on the Interactive Tool to increase the orifice diameter. Holding down the [Ctrl] key to increases in whole inches. [Shift] sets the increment to 0.10 inches. While increasing the orifice size the Actual line moves down towards the 2-year Target Line.
We can continue increasing the orifice size to where the two lines exactly match. In this case it will be at approximately 15.40 inches. The Schematic looks like this:
So far we have designed the following:
- 18-inch Culvert
- 4 x 4 ft Riser set at elevation 1006.00
- 15.4-inch Circular Orifice
Step 4 – Add the Rectangular Weir
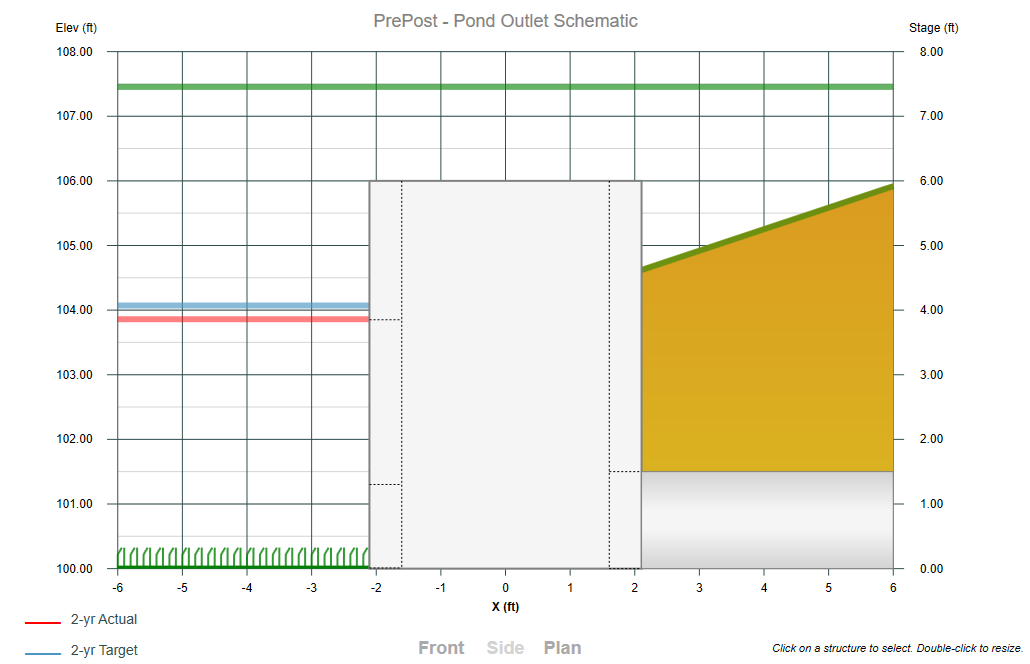
This step adds the device which controls the intermediate and upper frequencies. Note the elevation of the 2-year target at approximately 1003.90. We will set the crest of our new weir at this elevation. We click on the Weir selector and choose Weir 1 and add the following data and click [Add/Update].

Notice we set the Crest Elevation to equal the 2-year Target elevation at 1003.90. The 0.50 ft crest length was randomly chosen.
Next, we will select the next return period, 10-year, on the Trial Route table to reveal the Target and Actual lines on the Schematic.
Again, our goal is to adjust the size of the weir so that both red and blue lines match. We select the weir Crest Length on the input grid and click on the [Up Arrow] on the Interactive tool to increase the crest length. Holding down the [Ctrl] key to increases in whole inches. [Shift] sets the increment to 0.10 inches. While increasing the weir size we notice the Actual line moving towards the Target line.
The two lines closely match at a crest length equal to 1 foot.
Preliminary Design Complete!
That’s all there is to it. Our preliminary design is complete! We designed all three devices starting from the culvert and working through each return period designing the orifice and weir. All we need to do now is confirm and, if needed, fine tune our outlet sizes to where all of the Actual Qs are near or below the Target Qs.
Step 5 – Finalize Design
Now we need to see how our new design reacts to an actual routing. We simply click [Trial Route] and compare the Q Targets with the Q Actual.
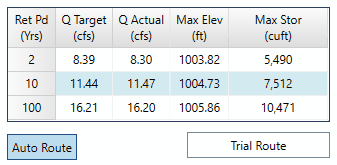
The results are nearly perfect!
The 10-year Actual Q is above its target by 0.02 cfs. If we felt compelled, we could make further adjustments to fine tune. If the [Auto Route] button on the Trial Route grid is toggled On the software will automatically perform the routing while adjusting.
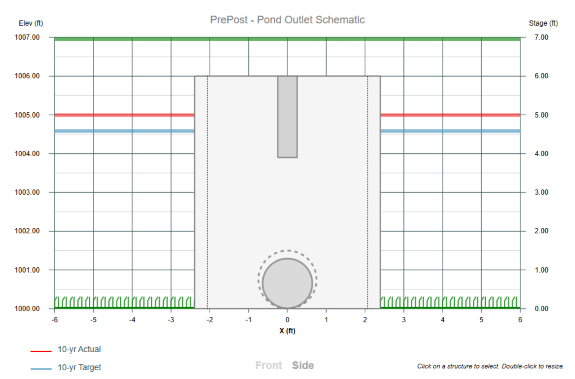
Our Structure schematic chart now looks like this as it displays the water surface elevations in the background.
 Below is the corresponding Stage Vs. Q chart. Notice how the Target Q aligns with the Actual Total Q.
 Below are the pre- and post-developed hydrographs as well as the routed outflow hydrograph.
 Conclusion
Hopefully this example has inspired you to try this on each and every pond design. It’s simple, direct, fast and requires minimal guesswork and messy iterations. Work from the downstream upward and design each structure as you go using the Target Q elevation lines. Set your inverts equal to the lower frequency elevations and use the Interactive tool to adjust the sizes to where the Actual “approximately” matches the Target. Use the Trial Route feature to fine tune.