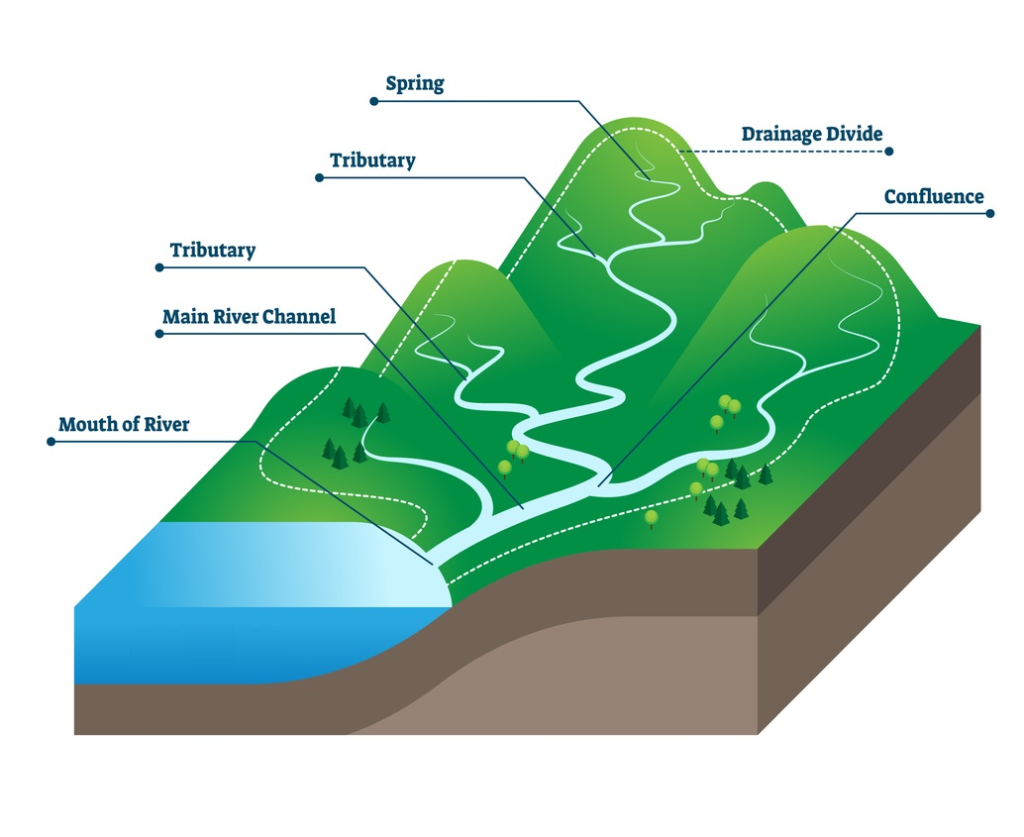
A basic watershed has been constructed and displayed below for this tutorial. In this lesson, you will be taught how to incorporate hydrographs into a basin model and link them according to the configuration of the watershed. The focus of this tutorial is solely on understanding watershed connectivity, not detention pond modeling.
… you will start at the uppermost drainage areas and progress downstream, adding runoff hydrographs to your basin model as you go along, and connecting them when necessary.
Similar to all watersheds, you will start at the uppermost drainage areas and progress downstream, adding runoff hydrographs to your basin model as you go along, and connecting them when necessary. The simulation of the watershed is achieved by choosing the appropriate function(s) from the Ribbon menu in the sequence of sub-catchment connectivity.
A Watershed Modeling Example
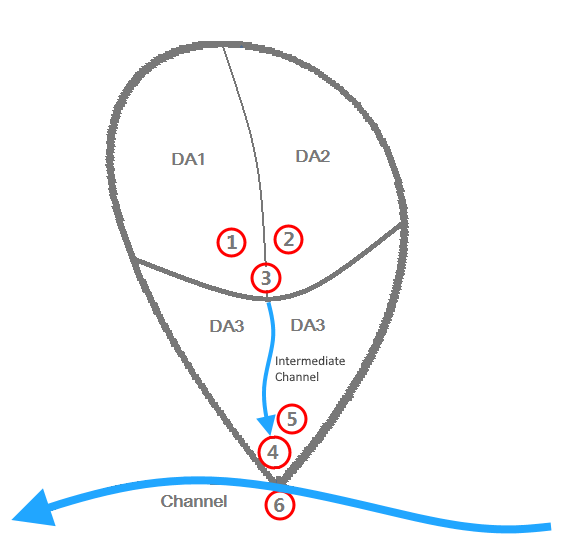
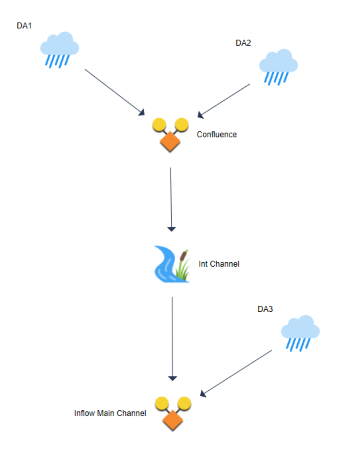
This particular watershed example comprises three drainage areas (subareas) and an intermediate channel. Our objective here is to create the most downstream hydrograph that discharges into a major lower horizontal channel.
To model the watershed shown below, follow these 5 easy steps:
- Create runoff hydrographs for sub-areas “DA1” and “DA2” — Hydrographs 1 and 2.
- Add (combine) Hydrographs 1 and 2 to form Hydrograph 3. (They converge at the same point, a confluence.)
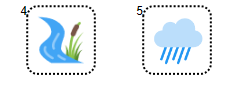
- Route Hydrograph 3 through the intermediate channel to create hydrograph 4.
- Create runoff hydrograph for sub-area “DA3” — Hydrograph 5.
- Lastly, add Hydrographs 4 and 5 to create Hydrograph 6.
Following is a step-by-step procedure working from the “Basin Model” tab. We’ll disregard the input particulars such as drainage areas, CNs, etc. This will be covered in complete detail in Part II. This tutorial is simply to illustrate the steps involved in developing a watershed “Basin Model” in Hydrology Studio.
Here are the steps in detail:
1. Add runoff hydrographs representing DA1 and DA2
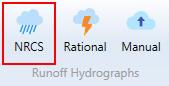
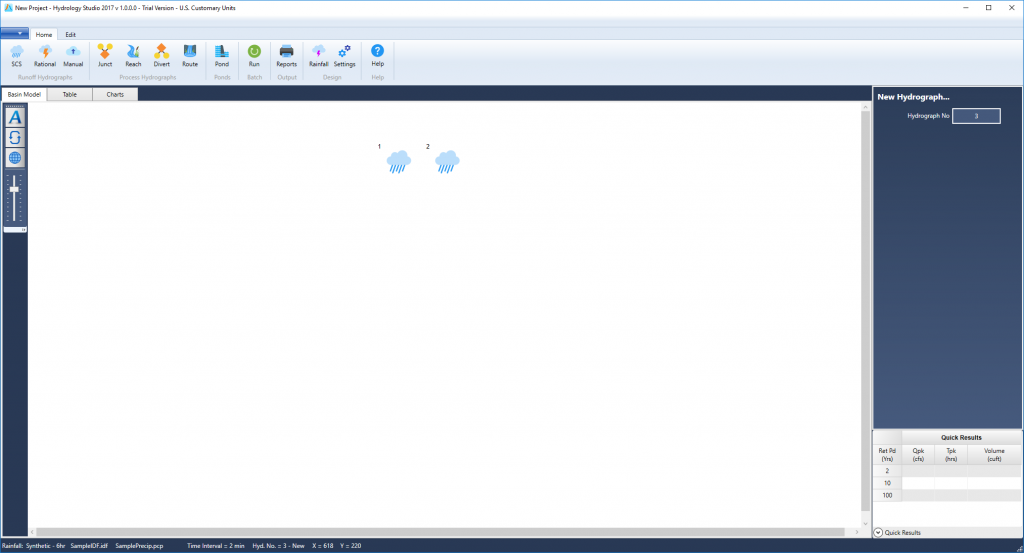
With the Basin Model tab selected as shown below, click your mouse anywhere on the open canvas. Then click the [NRCS] button on the Ribbon menu.
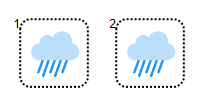
An NRCS hydrograph icon will be placed near the top center of your screen. This will represent DA1. Click the [NRCS] button again to add the second sub-basin, DA2.
2. Add the two runoff hydrographs to create a junction
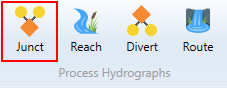
Since subareas DA1 and DA2 converge, we will combine these hydrographs to form a junction. This junction represents a confluence, Hydrograph 3. To add or combine hydrographs, select them first by dragging a rectangle around both of them with your mouse or alternatively, click on the icons while holding down the [Shift] key.
Then click the [Junct] button on Ribbon menu.
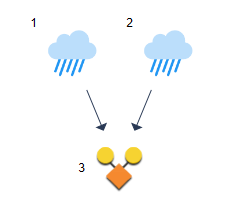
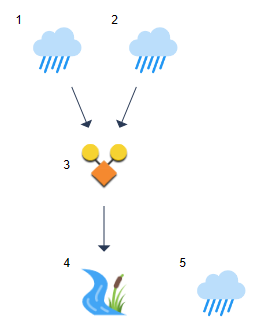
Your model schematic will now look like this:
3. Route Hydrograph 3 through the intermediate channel to create Hydrograph 4
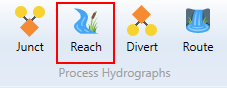
Hydrograph 3 then travels down a channel (Intermediate Channel) which outfalls into the Main Channel. We must perform a Channel Route. Select (click) Hydrograph 3 and then click the [Reach] button on the Ribbon Toolbar.
The updated Basin Model will show the following schematic:
 4. Add runoff hydrograph for sub-basin DA3
DA3 must be added to the model at this point because it also outfalls into the Main Channel. Simply follow the procedure shown in Step 1, i.e., click the [NRCS] button.
The updated basin model will look like this:
5. Combine Hydrographs 4 & 5 to create Hydrograph 6
At this point we have two hydrographs that outfall into the Main Channel. Since we only want a single hydrograph, we must combine (add) them. Select hydrographs 4 & 5 as you did in Step 2.
Then click [Junct] on the Ribbon menu.
Your final basin model should look like this: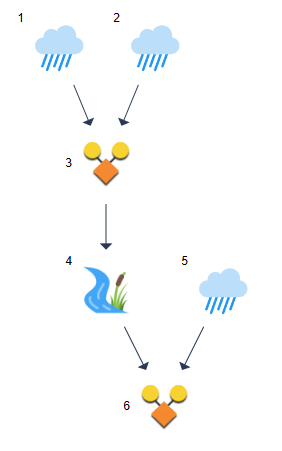
Hydrograph 6 is the final hydrograph that flows into the Main Channel.
Your Watershed Model is Complete
By starting from the furthest upstream location and progressing towards the downstream point, one can easily generate runoff hydrographs, combine them at confluences, direct them through channels or detention ponds, and divide them if necessary, until reaching the desired downstream point.
Modify the Icon Positions
You have the ability to adjust the placement of any or all icons on the canvas to more accurately reflect real-world scenarios by dragging them with your mouse. Additionally, you can reposition groups of icons by holding down the [shift] key while dragging, which will move all icons from the selected one downstream.
As you have noticed, we haven’t added any data to these hydrographs or computed anything yet. That is covered in Part II. Adding Data, Computing Results.