This article describes a procedure for localizing your Intensity-Duration-Frequency (IDF) curves for locations in New Zealand. It will assume your data source is NIWA’s (National Institute of Water and Atmospheric Research) High Intensity Rainfall Design System (HIRDS). Below are the steps required to produce IDF curves for use in any of the Hydrology Studio products.
1. Visit the HIRDS Website
Home Climate & Weather High Intensity Rainfall Design System (HIRDS)
While on this page, click the HIRDS Tool button.

2. Select Your Location on the Map
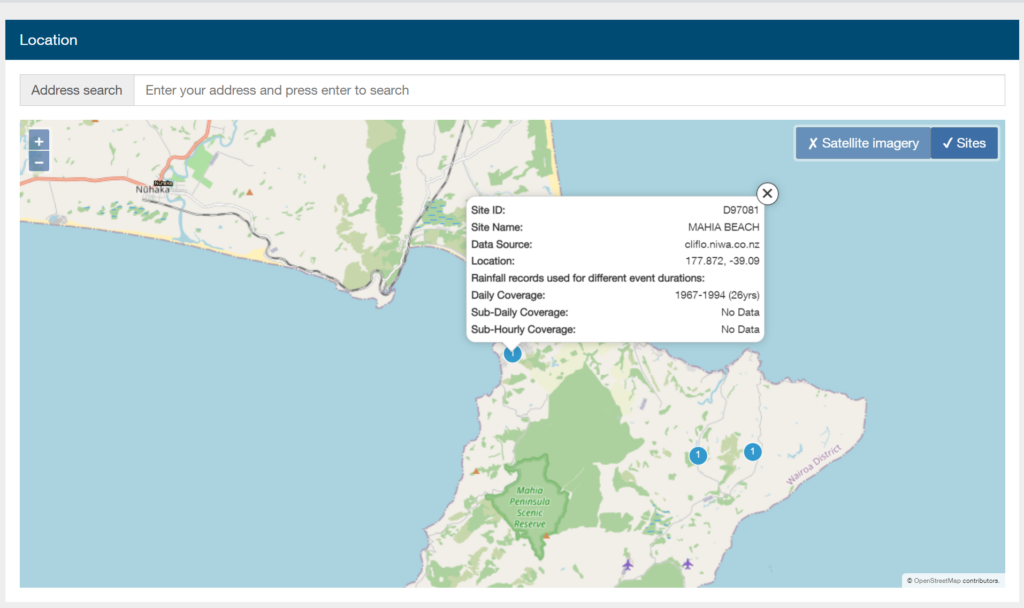
Using your mouse to pan and zoom, locate your site. In this case, MAHIA BEACH is selected. Note the Site ID = D97081 is automatically displayed in the pop-up box.
3. Generate the Rainfall Report
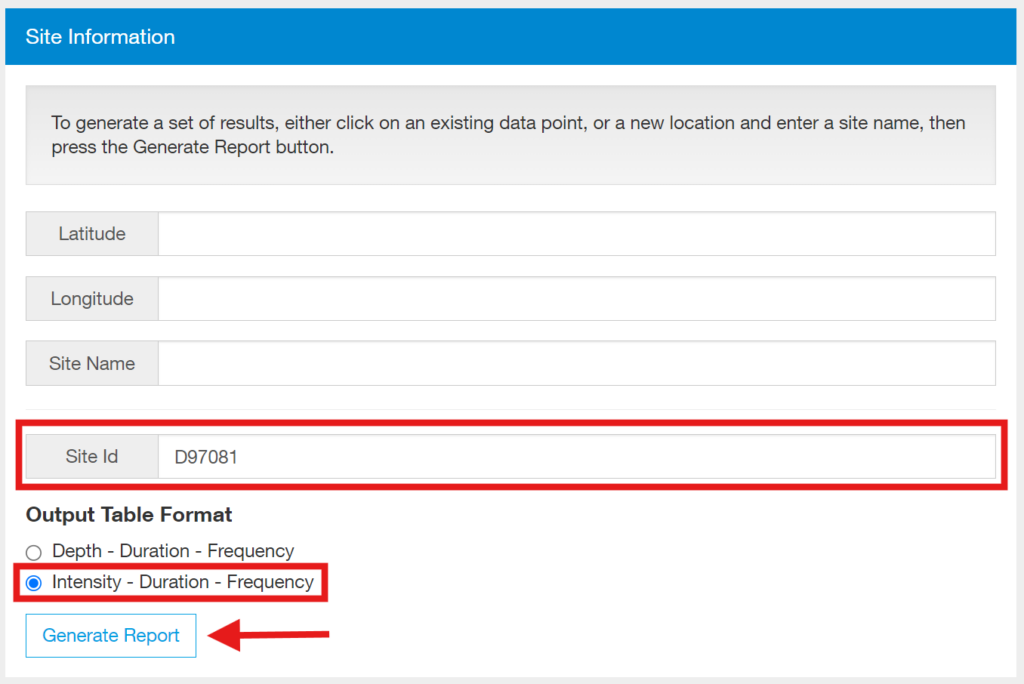
Verify the Site ID in the Site Information box to the Right. Select Intensity – Duration – Frequency radio button. Then click [Generate Report] as shown below.
4. Download and Open the Spreadsheet
After the report has been generated, click the [Spreadsheet Download] button at the right of your screen.

Then open it in Microsoft Excel.
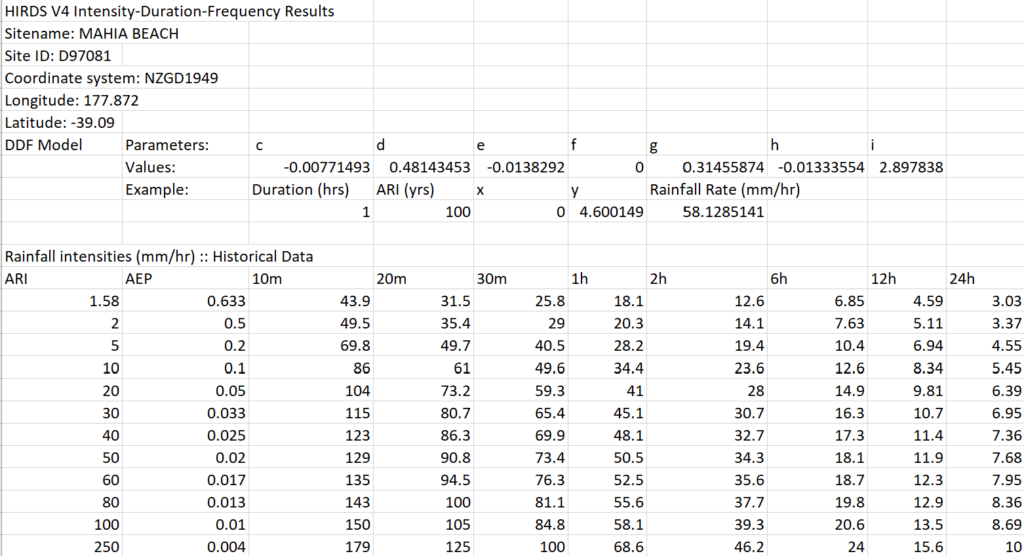
You should see a spreadsheet similar to this:
5. Generate and Extract Intensities
Hydrology Studio requires the 5, 15, 30 and 60-minute intensities for each frequency in order to create IDF curves that it can use. You’ll notice that HIRDS only provides the 10, 20, 30 and 60-minute values. Fortunately, the HIRDS spreadsheet supplies the equation used to generate Intensities at any duration. So you will utilize the equation to produce the missing 5 and 15-minute values. We do this by editing the Duration and ARI (yrs) cells.
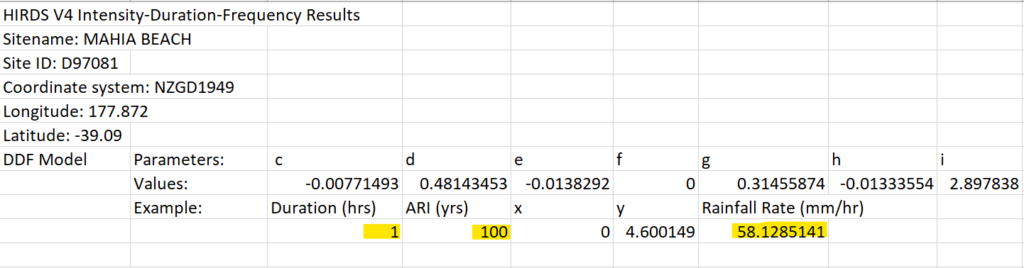
Initially you will see 1 hour (60 minutes) as the Duration and 100 for the Return period. Get the 5-minute value by replacing 1 with 5/60 or 0.08333 hours as shown below which rendered 211.5 mm/hr.

Repeat this to get the 15-minute (15/60) or 0.25-hour intensity.

Now we have the required 5, 15, 30 and 60-minute values for the 100-year frequency as 211.5, 122.0, 84.8 and 58.1 respectively.
| Time (min) | Intensity (mm/hr) |
|---|---|
| 5 | 211.5 |
| 15 | 122.0 |
| 30 | 84.8 |
| 60 | 58.1 |
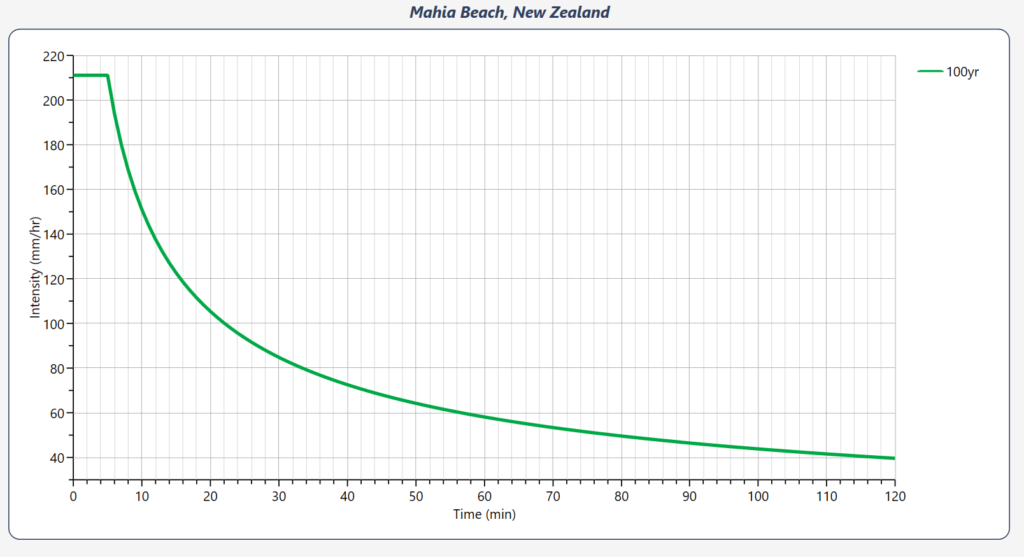
Once you have your required intensities, follow the procedure on this page to complete your setup. The IDF curve for Mahia Beach, 100-year, will look like this:
Continue generating the remaining intensities by utilizing the specified frequencies, which involves modifying the spreadsheet’s ARI (yrs) and Duration cells as previously outlined.
It is important to mention that adjustments to the Return Periods may be necessary to replace the 25-year period with a 20-year period. Details on that can be found here.