
Part I of this series stepped through the mechanics of calculating water surface profiles for open channels. It introduced concepts of energy and the role it plays in determining the the elevation of the water surface in various conditions. It serves as a backdrop and prerequisite to modeling real open channels where conditions aren’t always neat and clean as presented in Part I. Knowing the basics of the computations empowers you to make better decisions in the real world regarding:
- Locating your cross-sections
- Describing your cross-sections
Which is what we’ll cover here in Part II.
This article is not meant to teach you how to navigate Channel Studio or any other software’s user interface, but rather provide you with some key knowledge about open channel modeling. This way you will be equipped to successfully tackle any open channel modeling software. Either way the general process is always the same. You’ll draw a river reach; add cross-sections; describe cross-sections; add water and compute.
Think Gradually
To get the best results modeling water, you must think like water. Flowing water. Water does not flow making tight turns and sharp corners. Rather it flows smoothly downstream within its natural confines. That’s why you don’t see sharp or abrupt changes in the banks of natural channels. Natural channels are shaped by the water that flows through them. And when there are abrupt changes, like the upper and lower ends of bridge abutments, the flowing channel water will bypass that abrupt space and fill it with dead water or what we like to call, “Ineffective Flow Area”.
The key takeaway here is that water prefers to flow in a gradual state and we as modelers, must honor that fact. We do this by providing only gradual changes in the data that we plug in.
Maintain a “gradual” mindset and you will always be successful modeling open channels.
And keep in mind, the energy equation is only applicable to “gradually” varied flow.
As you discovered in Part I, water surface profiles are calculated by solving the Bernoulli energy equation in a standard step fashion between cross-sections representing the channel’s physical properties. The location of these cross-sections is critical and when not placed properly, your study will be plagued with no-solution errors.
Take the average of the numbers zero and 100. It’s 50. Fifty is a far cry from either of the two inputs, zero and 100. Not very “gradual” is it? This is what commonly happens to the novice open channel modeler. They mis-locate cross-sections, preventing the solution to the energy equation, violating the water’s will and right to flow gradually.
Let’s take a another look at the master equation introduced in Part I.
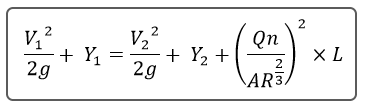
The section with all the Manning’s equation terms is the friction head, hf.
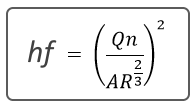
The procedure needs to calculate hf at both points, 1 and 2 (upstream and downstream) and then average them. If that average is too distant from the original two hf’s, the equation becomes unsolvable. Error.
How to Locate Channel Cross-sections
So how far apart and/or where do you locate cross-sections to insure a solution? After all, hf has a lot of terms referring to various properties like channel roughness, area, wetted perimeter and Q. The answer is conveyance.
Conveyance, K, is computed as:
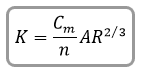
Where:
Cm = Manning Coefficient = 1.486 (1.00)
n = Roughness coefficient
A = Cross-sectional area of flow
R = Hydraulic radius = Area/Wetted Perimeter = square foot of Area per foot of Wetted Perimeter
Locate cross-sections along your channel so that conveyance between any two sections does not change by more than about 30%. If the n-values for two subsequent cross-sections are approximately the same then conveyance becomes a function of cross-sectional area, A.
Locate your sections so that the cross-sectional area does not change by more than 30% between sections.
If it does, insert additional sections. Again, gradual is key. Also keep in mind that channel slope affects area as illustrated in Part I. So you’ll want to add sections at any significant changes in slope as well.
To illustrate, consider the hypothetical channel plan below. Remember, your software and the energy equation has no clue what this channel looks like. It’s up to you to provide the data that best describes it within the confines of the methodology. Sections are located at key points along the channel as described below. Starting from the most downstream point. Let’s discuss them one-by-one.
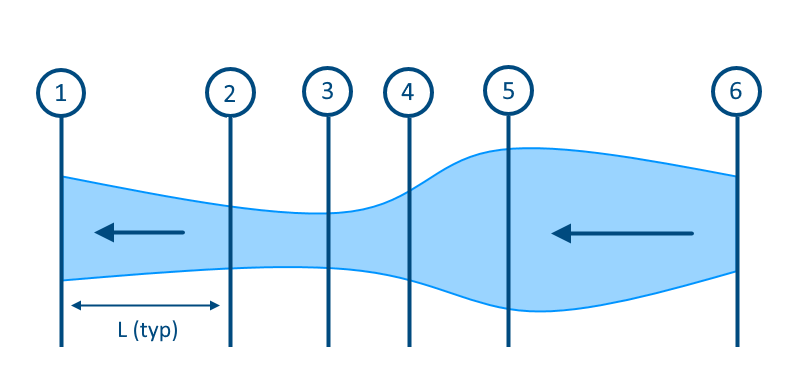
Sec 1 – Located at the most downstream point in the study area.
Sec 2 – Reduction in section area from Sec 1 by 30%.
Sec 3 – Reduction in section area is less than 30% but indicates narrowest part of channel.
Sec 4 – Increase in section area by 30% from Sec 3.
Sec 5 – Widest part of channel as well as an increase in area by more than 30%.
Sec 6 – Less than 30% change in area but it’s the most upstream end.
Notice that Sections 1, 3, 5 and 6 could have been used solely because they indicate key points along the channel but more sections needed to be supplied to honor the 30% conveyance rule.
Place Sections Perpendicular to the Flow
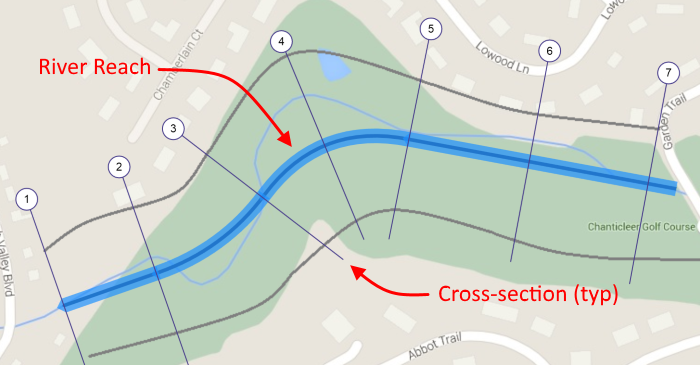
Your cross sections should be placed perpendicular to the direction of stream flow under flood conditions. Notice the large blue line in the plan below. It represents the river Reach.
The Reach serves as a placeholder for your Sections so it’s equally important that you locate the river reach properly. The best way to do this is to step back and look at the big picture. It doesn’t need to be perfect, you’re not building a watch. Visualize the outer limits of the floodplain or the final outer boundaries of the anticipated water surface. Then draw your Reach through the center of this boundary. Try to favor the main channel or the portion with the most flow or area but don’t let it dictate. As shown in the example below, the reach is drawn between the outer gray lines but stays fairly close to the thin blue line (the channel) but yet it stays gradual and smooth.
Note the Sections are not always perpendicular to the smaller blue line (the actual Channel) but are perpendicular to the outer gray lines (the main floodway).
If you are working with a floodway or channel that does not contain abrupt changes then follow these suggestions:
- Large uniform rivers with mild to flat slopes require cross sections about every 1,000 ft. (300 m).
- Narrow, confined channels in urban areas need cross sections about every 500 ft. (150 m) or less.
- As a “rule-of-thumb”, cross sections can be spaced at about 5 times the channel widths. So if your cross-sections are roughly 100 feet wide, place sections every 500 feet along the Reach.
Describing Channel Cross-sections
Now that we know where to locate the cross-sections, we next need to learn how to properly describe the cross-sections.
As you saw above, the computation of conveyance, K, for each water-surface application requires a hydraulic radius, R. The hydraulic radius represents the average depth of conveyance. If there is significant irregularity in the depth across any given section, the hydraulic radius may not accurately represent the flow conditions.
Think Like a Land Surveyor
So again, think gradually but also think like a land surveyor performing a topo survey. Just like in the plan view above, we need to insert data points at strategic locations to give the calculation procedure a clear picture of what the Section actually looks like.
Remember, your computer is clueless. It’s blind and can only feel its way around using supplied data.
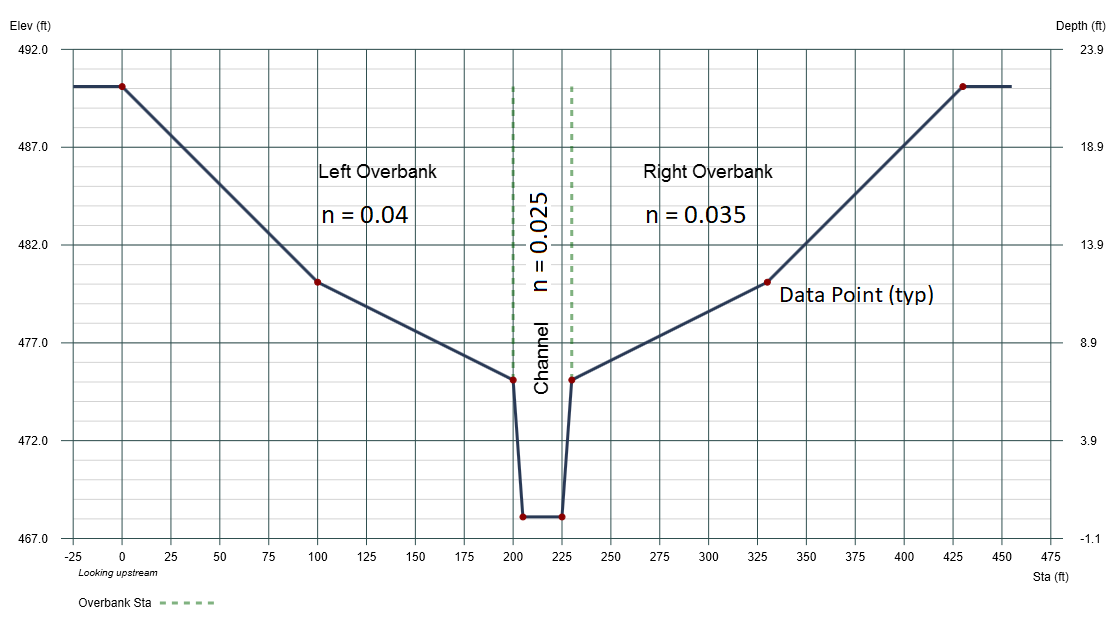
Above is a typical open channel cross-section as looking upstream. The first thing you need to do is gather data points, just like a topographic survey, that indicate changes along the section. Above you’ll see where points (station and corresponding elevation) were taken at significant changes in the bank slope. These are indicated by the red dots at stations 0, 100, 200, 210, 225, 230, 330 and 430. Keep in mind the calculation procedure will assume straight lines between your points. If, for example, you left out Station 100, the calculations would assume a straight line between 0 and 200, missing that additional area.
Use only enough points to adequately describe the cross-section. Don’t overdo it. Remove any points that seem redundant. Simpler is always better.
Will it Hold Water?
This may sound silly but… before you move upstream, always try to visualize pouring water into the section. Will the described section hold water? At what elevation will the water run off the side? In other words, be sure to complete your geometric data from upper left to upper right. Imagine if the section above was missing that last point at Station 430. The section would be useless above elevation 480.
The section above was submitted to me by someone who used a TIN surface to describe sections. While a TIN surface will save an enormous amount of time, please take time to inspect each cross section, ensuring that it is wide enough to reach the other side. This section obviously cannot hold water. It would run off to the right.
Subdividing Channel Cross-sections
You’ve described your section by indicating changes in geometric characteristics. Now you need to indicate any changes in hydraulic characteristics or roughness elements along the section because conveyance is inversely affected by Manning’s n. If the geometric boundary has a uniform roughness then just specifying a single n is appropriate. However, if the roughness of the surface varies it may be necessary to break the section up into separate sub-sections, namely Left Overbank, Channel and Right Overbank, in order to get a more accurate read on the conveyance.
The sample cross-section shown below is typical of natural open channels. It has a well-defined channel near the center and is basically bare earth, winding, no vegetation and is kept clean by a constant flow of water. The overbanks rarely see water and consist more of grass and light to dense brush. In this case it will be necessary to provide data that describes these abrupt change of roughness.
There’s not much to it. You simply need to indicate the n-values for each sub-section and the Overbank Station points. In the section above, the Left Overbank has an n-value of 0.04. The Station of the Left Overbank is 200. This tells the software that from Station 0 to 200, the n-value is 0.04. The Channel portion has an n of 0.025. The Station of the Right Overbank is 230. This tells the software that the Channel portion extends between Stations 200 and 230. The Right Overbank runs from station 230 to the very end. It’s n-value is 0.035.
Once you have a subdivided a section you should continue to subdivide the remaining sections as you work upstream, even if the n-values are consistent across the section.
Special Cases You Should Be Aware Of
There are certain times when you should subdivide the section even though the n-values are the same across the entire section. One such case is called the Panhandle.
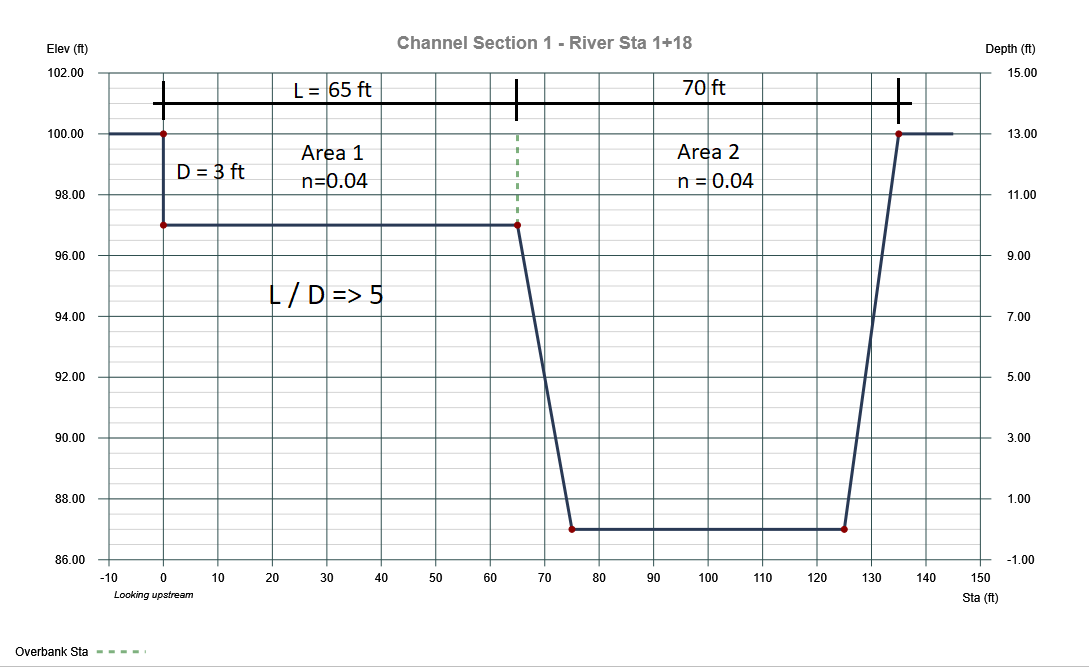
A bench panhandle, or terrace, is a shape where the increase in wetted perimeter, Wp, of the floodplain is relatively large with respect to the area, A. The hydraulic radius (A/Wp) is dramatically reduced, and the calculated conveyance of the entire section will be lower than the conveyance of the main channel. To counter this, subdivide panhandles if the ratio L/D is equal to five or greater.
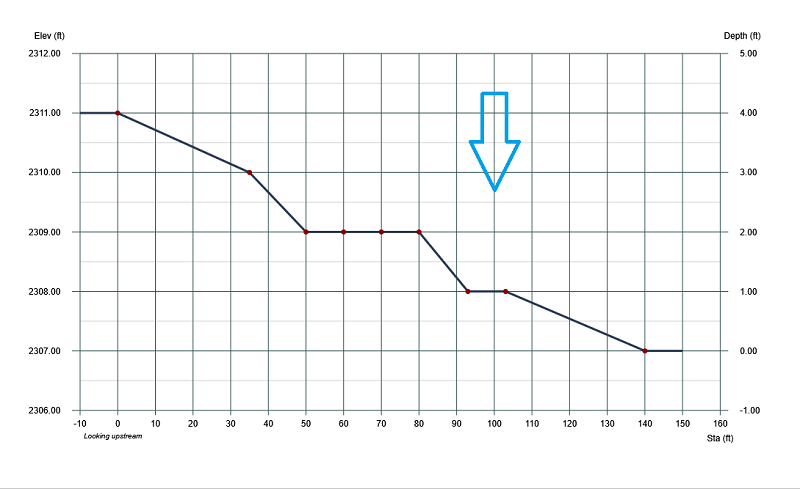
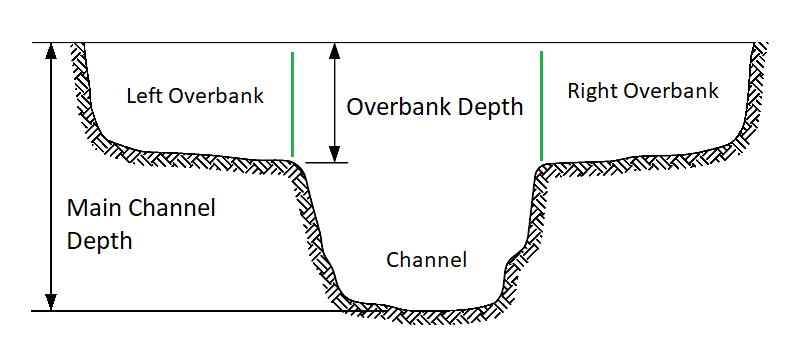
Another shape that causes problems in subdivision is when the main-channel depth is more than twice the overbank depth. In these cases, regardless of n-values, you should subdivide the section into overbanks and channels as shown below.
Once the sections have been subdivided, the calculation procedure basically converts it into a single reach length by using a discharge-weighted average.
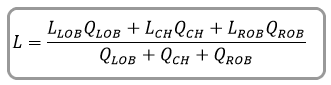
Where:
LLOB, LCH, LROB = Reach lengths for left overbank, main channel, and right overbank, respectively
QLOB, QCH, QROB = Flows for left overbank, main channel, and right overbank, respectively
Setting Reach Lengths
Okay, you now have your reach in place and have located cross-sections along this reach. We have also described how these sections look with accurate geometric data and proper subdividing using Overbanks and Channel locations. Next, you need to specify the distance between your sections, Reach Lengths. If you have subdivided sections then you’ll need to indicate the reach lengths for each sub-section. Left Overbank, Channel and Right Overbank.
Remember that your actual Section locations along the reach do not necessarily imply the reach lengths, but rather the location of the Section marker. This allows us to specify any reach length(s), independent of the section markers.
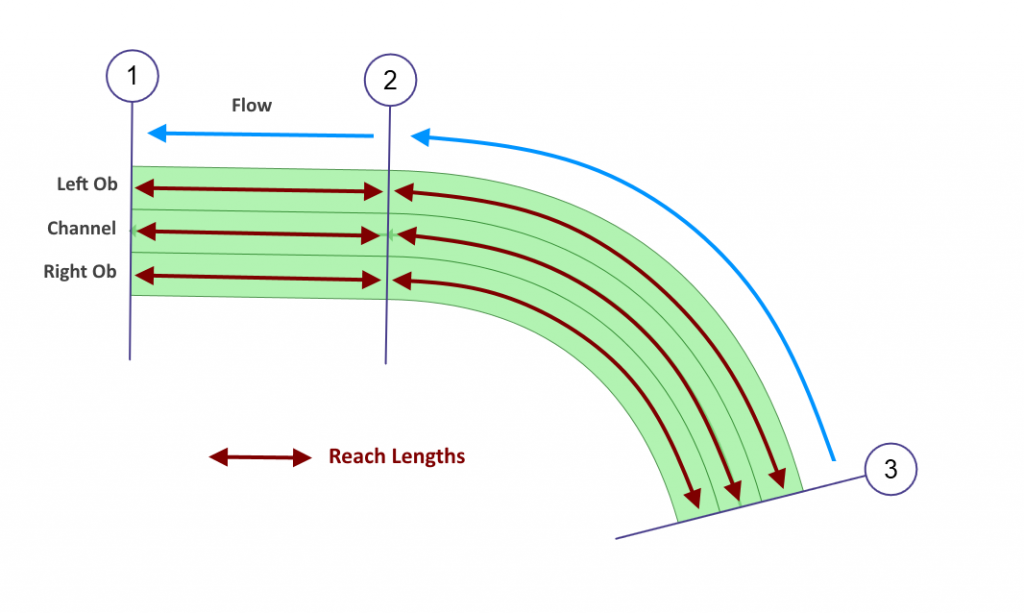
Reach lengths are simply the distance the water travels through the individual sub-sections from one section to the next. As shown above, between Sections 1 & 2, the Overbanks and Channel distances are pretty straightforward and basically equal. However, if the Channel part meanders, and they usually do, the reach length of the Channel would increase and be longer than it’s adjacent overbank reach lengths.
Additionally, if the reach is curved as shown between Sections 2 and 3 shown above, the outer reach (Left Ob) is longer than the inner reach (Right Ob). The point is, specify the actual running distance the water travels between sections for the overbanks and channel.
Summary
Your two main takeaways from this article are:
- Think gradual, like flowing water when locating your cross-sections along your reach
- Think like a land surveyor when describing your cross-sections
Now add water. If you’re unsure of the starting water surface elevation at the beginning section, use Normal Depth. Otherwise use a known elevation… that is above critical depth. Start your project as far downstream as you can stand. By the time the profile gets up to your site, any possible errors in your beginning assumed conditions will be minimized.
Open channel hydraulics can be tricky and frustrating when you don’t know what you don’t know. But when you do know, it’s actually a very rewarding experience. Just follow the guidelines outlined above and you’ll be successful in open channel modeling. And when the conference room sounds like crickets at the mention of backwater curves, you’ll have something meaningful to contribute.