
As mentioned in the previous section, Channel Studio evaluates both Contraction and Pier scour. All that is needed from the user is the bed material, D50 (the median diameter of the bed material, diameter which 50% of the sizes are smaller) and a selection of the pier nose shape. Provided the user enters this data, Channel Studio automatically computes Contraction and Pier scour. Results are presented as cross-sectional and profile plots as well as numeric.
Graphical Results
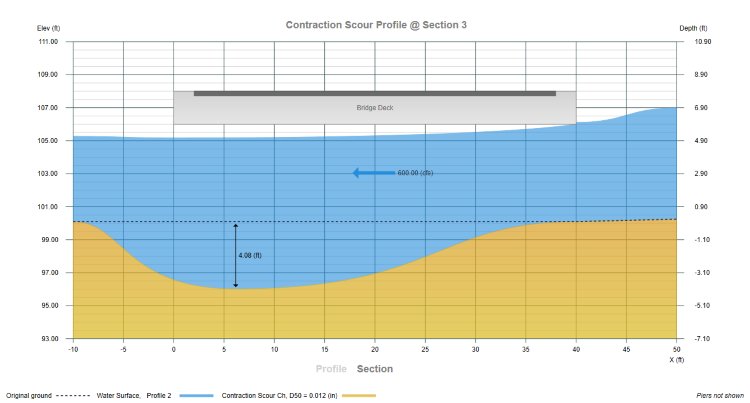
Graphical results can be seen on the X-Section plots in either Section or Profile view as shown below:
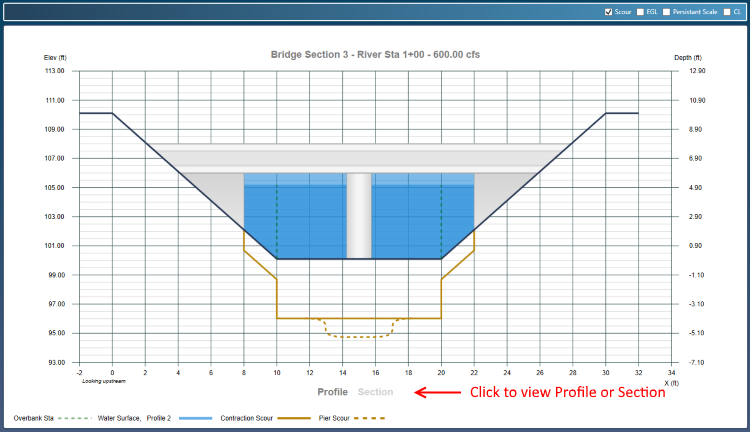
You can toggle on/off the scour results using the check box at the upper right. You can also view this in profile by clicking the Profile label at the bottom center of the graph. The maximum depth of the contraction scour is located 0.154 x Bridge Deck Width from the downstream end of the deck.
The graphical plots can be printed out along with other cross-sections by clicking on the [Print] button of the top Ribbon Menu, Home tab. See, Printing Results for more information.
Numerical Results
Numerical results can be seen on the Quick Results tab to the right of the main window. Numeric scour results are currently not a part of the formal reports but can be exported to a file for further processing. Below is a description of the outputs.
Critical Velocity
The velocity above which bed material of size D and smaller will be transported, ft/s (m/s). The Critical Velocity as shown in this table is computed using the total cross-sectional area (overbanks and main channel) and top width of the approaching cross-section. It is computed individually for the overbanks and main channel during scour calculations.
Scour LOB, Channel, ROB
The scour depth as computed for the Left Overbank, Main Channel and Right Overbank areas respectively.
Scour Pier
The depth of scour for this pier. This is ultimately added to the Contraction scour as indicated on the X-Section plots.
Export to a file by right-clicking anywhere on the results table.