During calculations Studio Express automatically uses built-in rainfall data. The software ships with default data for which is useful while getting to know the program. But eventually you’ll want to setup your own local data. The program stores this data in a separate file with an “IDF” file extension.
Studio Express automatically manages this file for you in that it opens it upon launch and saves it when exiting if anything has changed. This IDF file should be saved in your Studio Express/Rainfall folder but you may choose any folder you’d like. Just be sure that the software can access it upon its launch. The IDF file currently in use will be shown in the drop-down frequency list box when selecting a return period to use.
If you have setup several unique IDF curves for a variety of locations, you can open any one of them at any time to use for your current project.
All rainfall files are embedded in each project file so it is not necessary, for example, to email an associate, the .stx project file and the associated IDF rainfall file.
Use RainMaps™
The easiest way to setup and localize your IDF curves is to use RainMaps™. RainMaps™ is a cloud-based server which contains Hydrology Studio Suite specific rainfall files you would normally have to set-up in the software either by direct entry of data or importing from NOAA Atlas 14. We’ve taken all of the steps required to create these files so you won’t have to. And they are available with just a couple of mouse-clicks.
If RainMaps™ is not an option for you and you’d prefer to customize, please continue reading.
How to Customize the IDF Curves
Studio Express allows you to customize the IDF rainfall data. It provides a variety of methods to choose from for setting them up.
To begin, select the Hydrology tab on the top of your main window (Ribbon). Then click the [Rainfall] button on the Ribbon Toolbar to open the Rainfall IDF Wizard.


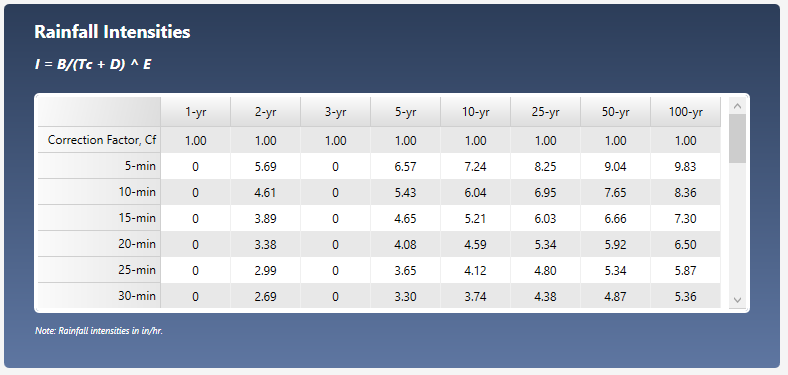
This screen displays the current set of IDF curves. Note that IDF curves, no matter what method was used to develop, are equation-based in the end and have no time limit even though the graph displayed only shows intensities up to 60 minutes.
Click the Table tab to view the curves in numeric format. The curves cannot be edited on this screen.
To get started on customizing the IDF curves, click the [New] button on top.

This opens the IDF Wizard which will walk you through a series of steps.

You have three choices to start. Option 2 below is the most popular and is recommended.
1. Create using rainfall map data
Use this method to enter precipitation values directly from Hydro-35 (Eastern United States) or NOAA Atlas 2 Maps (Western United States). Use this method if your state is NOT listed on NOAA Atlas 14. Read article here.
2. Enter intensities from your existing curves or from the newest NOAA Atlas 14 (Recommended) Read article here.
3. Enter known equation coefficients
Studio Express uses two types of equations, FHA (IDF Equation) and Third-degree Polynomial. You may directly enter coefficients for these rainfall intensity equations. Read article here.