How to Perform Retention Pond Mounding Analysis
Design Example #1
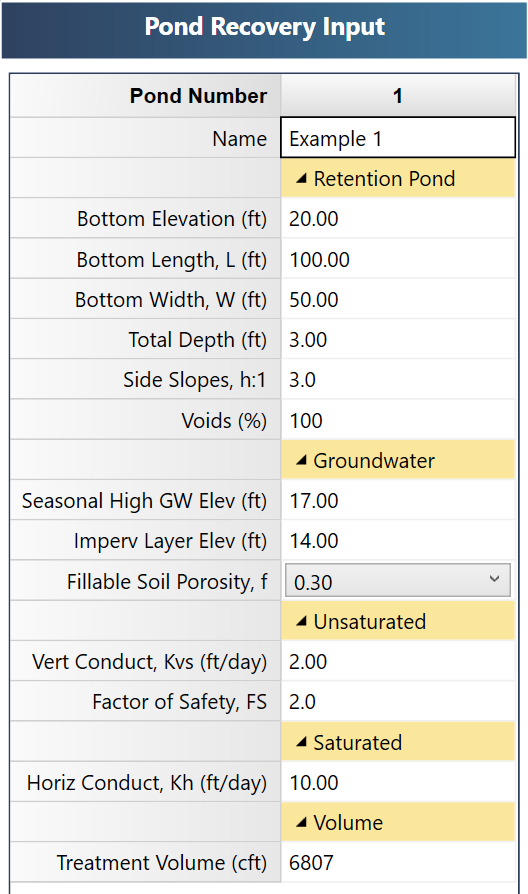
The following design example demonstrates how to use Studio Express Groundwater feature for estimating retention basin recovery times.
Given:
Commercial land development project of 1.5 acres with 60 percent impervious area.
Basin bottom elevation = 20.0 ft
Basin length = 100 ft
Basin width = 50
Basin depth = 3.0 ft
Basin side slopes = 3:1 (h:1)
Seasonal high water table = 17.0 ft
Impervious layer elevation = 14.0 ft
f = 0.30
Kvs = 2 ft/day (Vertical)
FS = 2.0
Kh = 10 ft/day (Horizontal)
Calculate Treatment Volume
For this example the water quality volume is 0.5 inches or 1.25 inches x impervious area, whichever is greater, plus an additional 0.50 inches.
0.5/12 x 1.5 x 43,560 = 2,723 cft
1.25 x Imp Area = 1.5 x 0.6 x 1.25/12 x 43,560 = 4,084 cft > 2,723 cft
Total Treatment Volume = 4,084 plus 2,723 = 6,807 cft
Data Entry
Enter this data into Studio Express Groundwater as shown below, and click [Compute].


Results
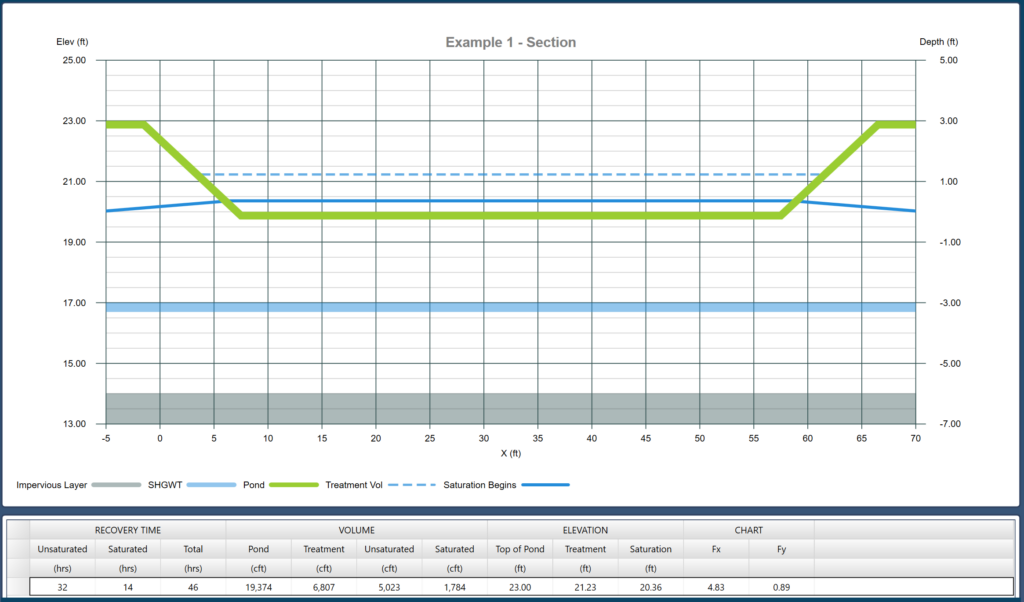
Below are your results.

The Infiltration Analysis
Once the Treatment Volume was introduced to this basin, the water elevation rose to 21.23 ft (dotted line). Vertical, unsaturated flow began and later stopped at full saturation. It took 32 hours and used up 5,023 cft of the Treatment Volume. This left 1,784 cft in the basin at a water level of 20.36 ft (solid line). It then took 14 hours for that volume to infiltrate horizontally, until the basin was empty. Total time to recover is 32 + 14 = 46 hours.
Getting a Printed Report
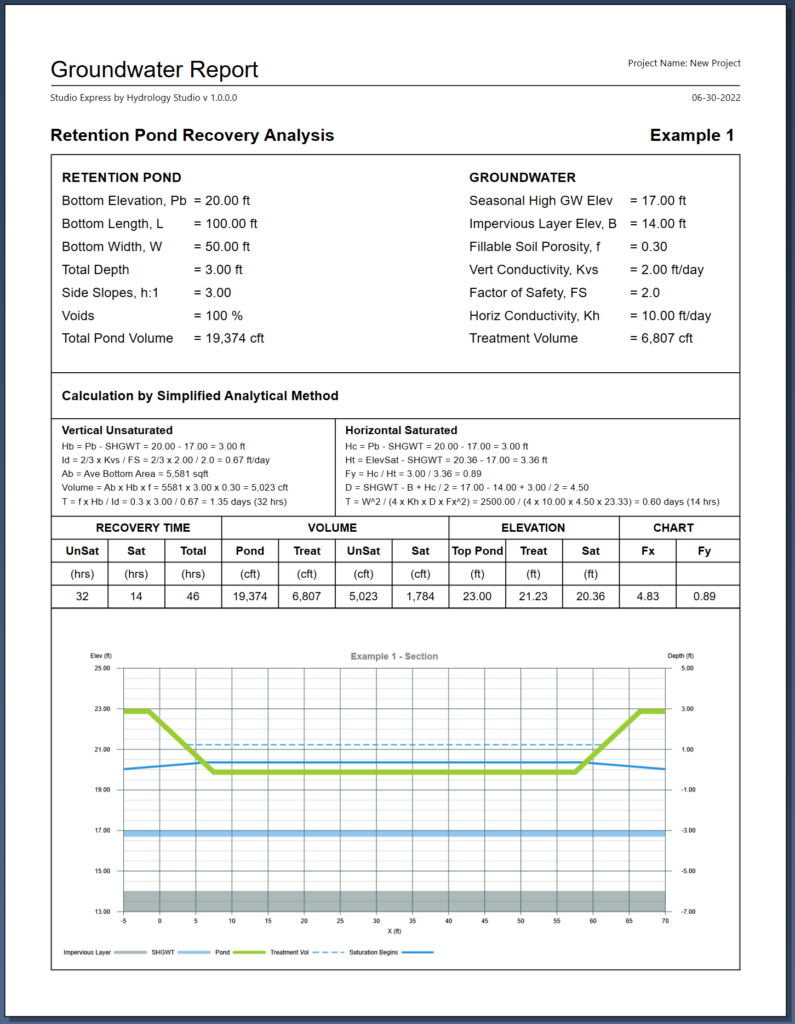
A final report can now be viewed and printed. Included in this report are detailed calculations to properly document your work. Click the [Reports] on the Ribbon tool bar and you should see the following:

On this report you’ll notice detailed calculations. Also note that the bottom area, Ab, of the pond plays a key role in the unsaturated time analysis. Studio Express uses not just the basin’s bottom contour area but an average of the bottom and the contour area at the design water level of 21.23. Ab = (5,000 + 6161.46) / 2 = 5,581 sqft. You’re getting credit for the expanded area due to the basin side slopes.
Including Other Charts
You can also include the other charts provided in the Groundwater feature, i.e., Stage-Storage and Fx-Fy, by right-clicking on them and selecting “Export this chart…”. You can save to a variety of bitmap formats. If viewing any of those charts while generating a report, it will be that chart shown on the report.
