Printing Reports
Studio Express offers stylish and easy-to-read printed reports. To print, simply click the [Reports] button on the Ribbon Toolbar. A document viewer automatically appears allowing you to preview the report before sending to your printer.
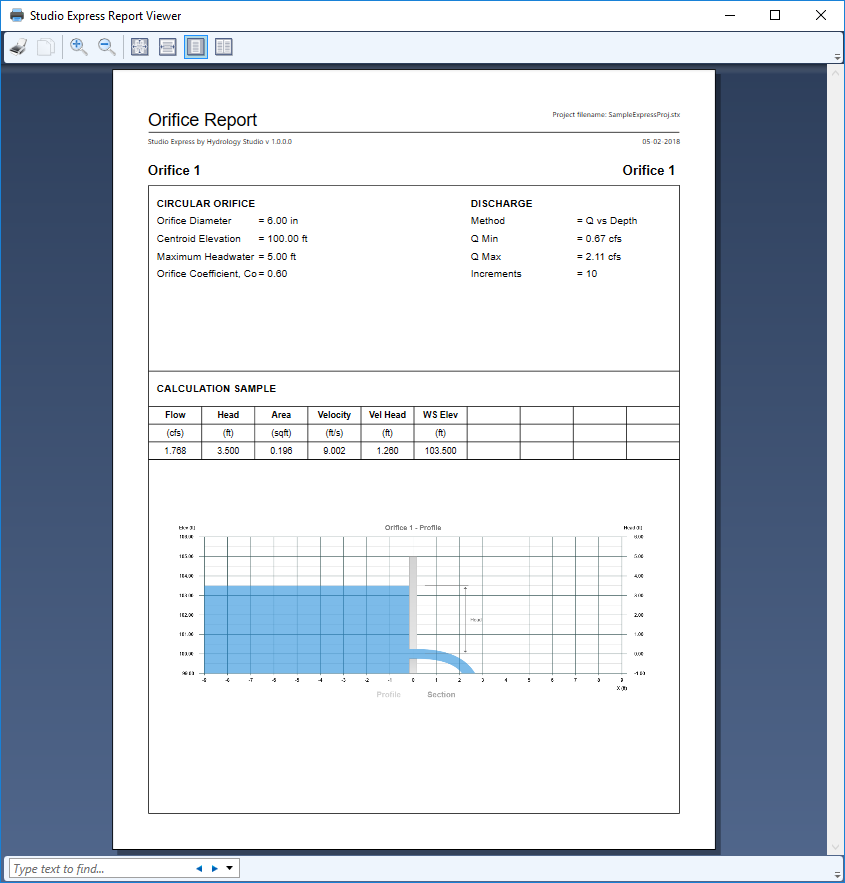
The report that you produce depends on the task you are using as well as which results grid row has been selected. For example, if the Profile option has been selected on the Orifices tab, the report will contain the Profile view as shown below.
If the computed results are current, a Calculation Sample grid is included which corresponds to the selected row on the Results Grid.
Printing to PDF
Studio Express does not provide a “PDF” print option directly but you can certainly employ any of the third-party PDF Printer drivers available on the market. When using these, you may need to turn OFF any image down-sampling and/or JPEG compression in the pdf driver’s printing preferences from the Windows printer settings. This will maximize the quality of the Plan, Section and Profile drawings.
Exporting Results
You can export the Results Grid by right-clicking on the grid and selecting either “Export this grid…” or “Copy this grid” from the pop-up menu.
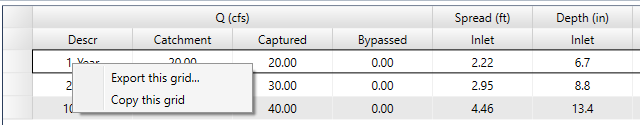
When exporting, you’ll have the option to save it as a .csv, .txt or .html file. Copying the grid copies it to the Windows clipboard.
Saving Charts
You can save any plots on the Canvas by simply right-clicking on the chart with your mouse and selecting, “Export this chart…” File options include .jpg, .png, and .bmp.