Perform Stormwater Retention Pond Recovery Analysis using UG Chambers
Design Example #2
The following design example demonstrates how to use Studio Express Groundwater feature for estimating retention basin recovery utilizing the for an underground chamber system.
Given:
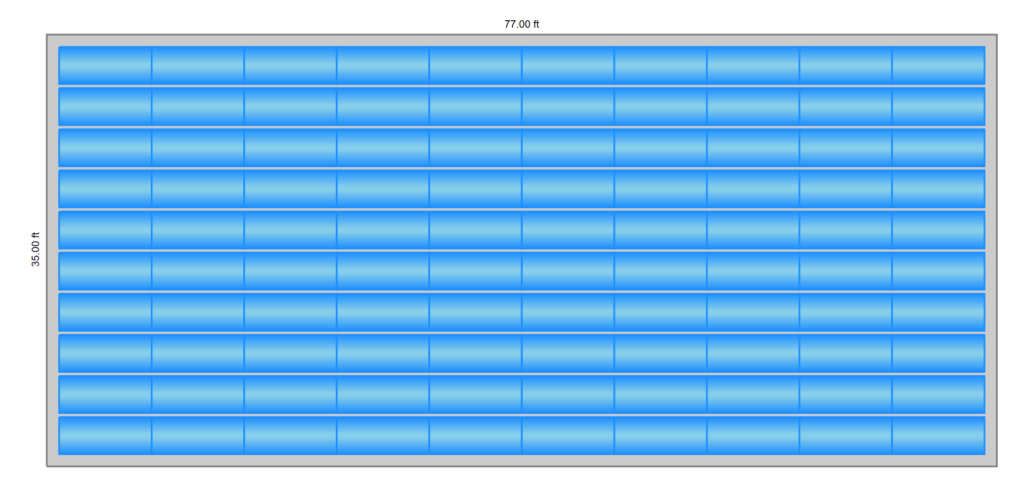
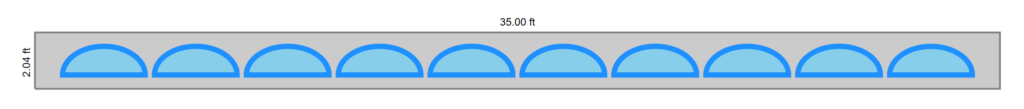
This site will utilize 100 underground chambers over 10 rows as shown in the plan below. This plan was designed in Hydrology Studio using Cultec Contractor 100HD chambers.
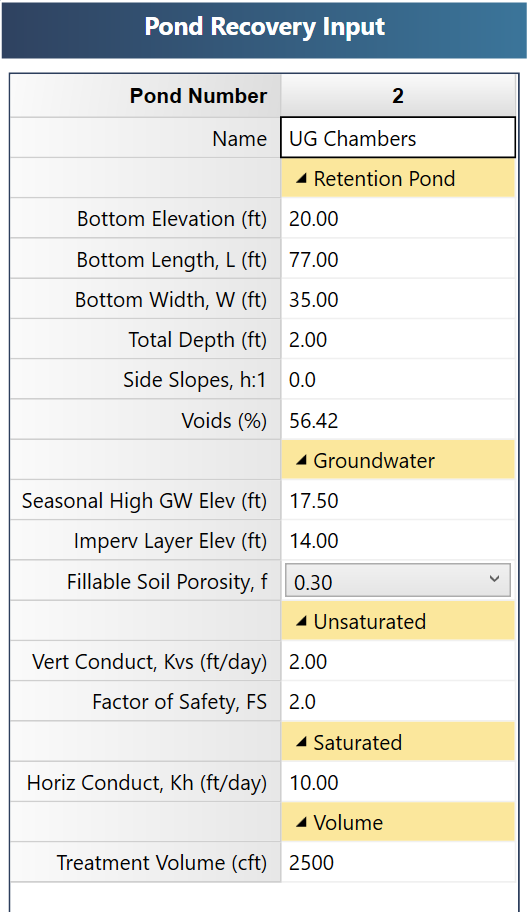
Basin bottom elevation = 20.0 ft
Basin length = 77 ft
Basin width = 35
Basin depth = 2.0 ft
Basin side slopes = 0
Voids = 56.42% (details below)
Seasonal high water table = 17.0 ft
Impervious layer elevation = 14.0 ft
f = 0.30
Kvs = 2 ft/day (Vertical)
FS = 2.0
Kh = 10 ft/day (Horizontal)
Treatment Volume = 2,500 cft
Compute the Equivalent Voids
The determination of the void ratio is a crucial aspect in the analysis of underground chambers. Studio Express Groundwater, however, does not specifically focus on underground chambers, but rather on open or stone-filled rectangular basins. The voids in underground chamber systems exhibit slight variations in depth, indicating the presence of clear open chambers near the vertical center of the basin.
For these situations, accurate results can be obtained by back-calculating a void ratio that provides the equivalent volume.
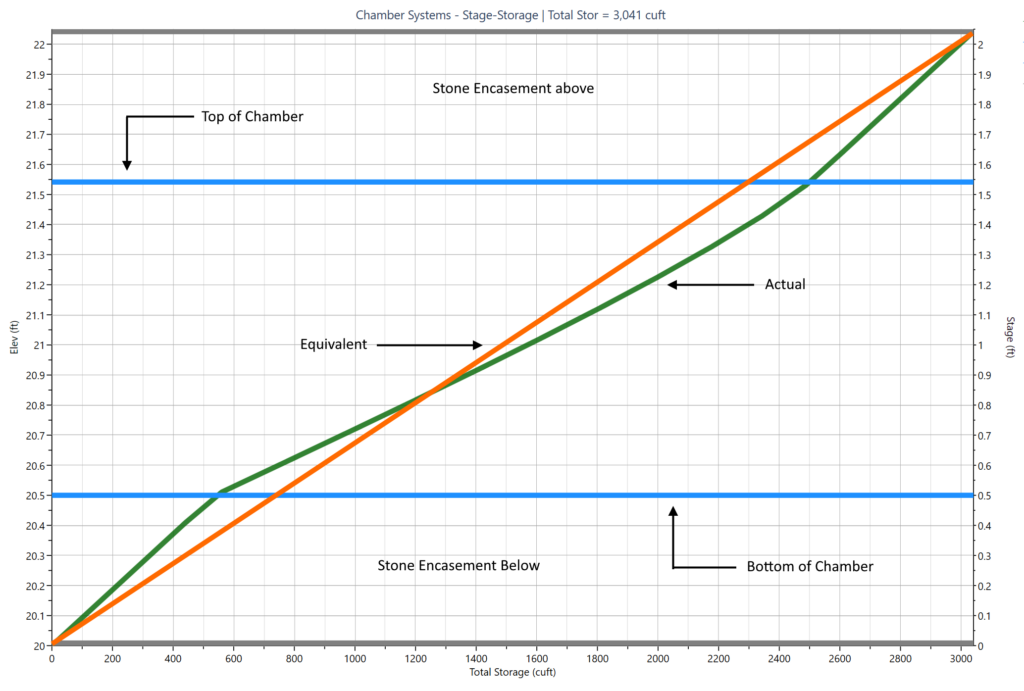
Using Hydrology Studio’s pond designer, the total volume for this UG chamber system is 3,041 cft. The volume of an open basin 77 x 35 x 2 = 5,390 cft. An appropriate void ratio to specify in Studio Express is the volume of the UG chambers divided by the Open Volume or 3,041 / 5,390 x 100 = 56.42%.
Below is the Stage-Storage curve for both systems.
Data Entry
Enter this data into Studio Express Input Grid as shown below, and click [Compute].

Below are the results.
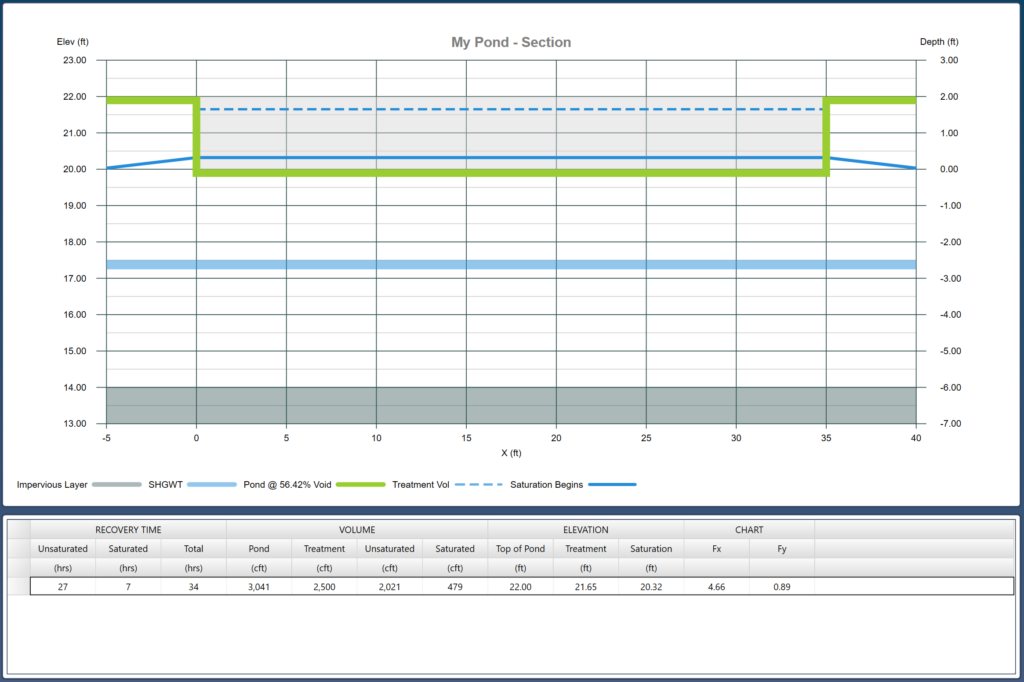
The Infiltration Analysis
Once the Treatment Volume was introduced to this underground basin, the water elevation rose to 21.65 ft (dotted line). Vertical, unsaturated flow began and later stopped at full saturation. It took 27 hours and used up 2,021 cft of the Treatment Volume. This left 479 cft in the basin at a water level of 20.32 ft (solid line). It then took 7 hours for that volume to infiltrate horizontally, until the basin was empty. Total time to recover is 27 + 7 = 34 hours.
Note that L/W = 77/35 = 2.2. Since 2.2/2 – 1 is <= 10%, the L/W value will be rounded down to 2. Any L/W’s that are not within 10% of 1, 2, 4, 10 or 100 will be not be rounded and Fx will be interpolated between the adjacent charts.
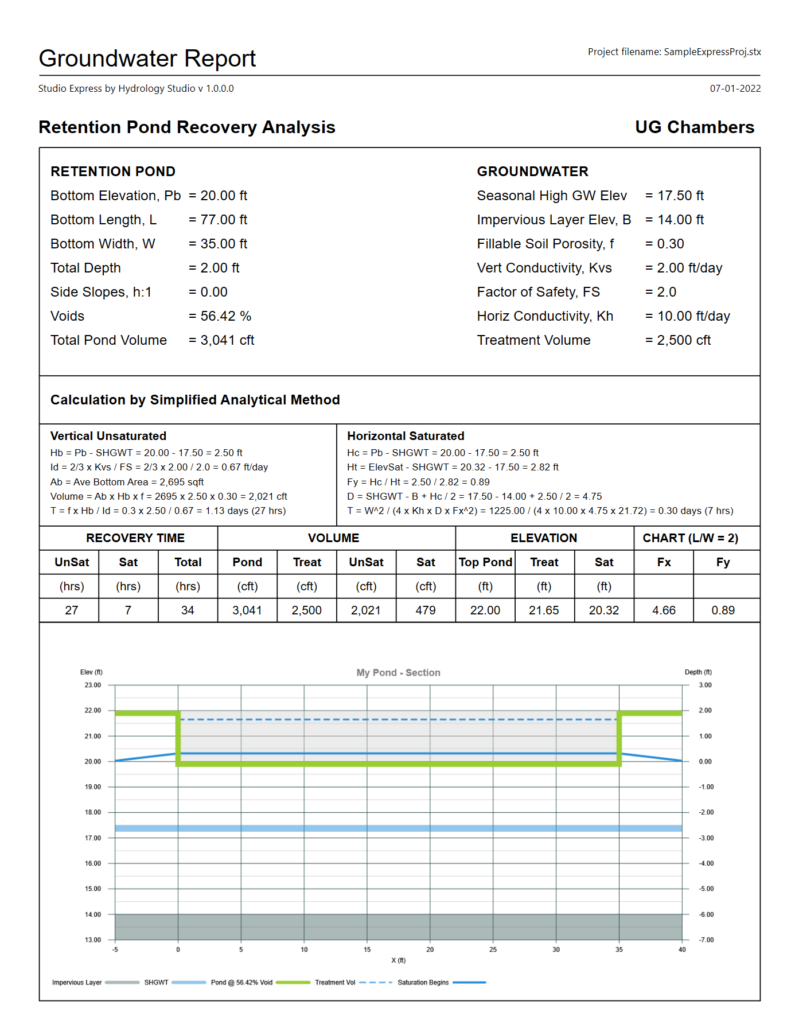
Getting a Printed Report
A final report can now be viewed and printed. Included in this report are detailed calculations to properly document your work. Click the [Reports] button on the Ribbon tool bar and you should see the following:
You can also include the other charts provided in the Groundwater feature, i.e., Stage-Storage and Fx-Fy, by right-clicking on them and selecting “Export this chart…”. It will save to a variety of bitmap formats. In addition, if viewing any of those charts while generating a report, it will be that chart shown on the report.