Hydrology Studio can accept up to 20 unique user-defined contours to describe a pond. Three is the minimum. They can be of any contour interval and the contour interval can vary along the way. Once entered, you’ll have the ability to Copy & Paste, Insert & Delete and Scale your contours up or down, optimizing the size of your pond.
The process entails entering contour areas starting from the bottom of the pond and working upwards. The storage values are automatically computed using either the Average End Area method applied vertically or the Conic method. It’s your choice.
To start, select a Pond and provide a Pond Name. Then select the Contours button.
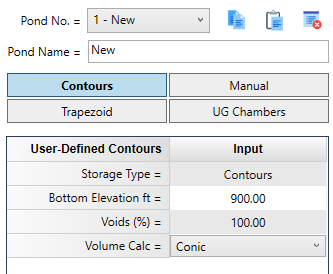
Then double-click the Bottom Elevation input on the input window.
Required Data
The following is a description of each of the required input items. Click the Help option button at the top of the input table to view a help diagram.
Bottom Elevation
Type in the elevation of the bottom of the pond.
Voids (%)
This value defaults to 100 and is useful for modeling gravel-filled trench drains. It allows for a reduction in storage due to gravel fills and such, but still allows the total surface area available for exfiltration calculations.
Volume Calculation
Select your preferred method of computing incremental storage from the drop-down list.
- Average End Area
- Conic Method
Please see, Computational Methods for more information on these methods.
Next, click the [Apply] button at the bottom of the input window. This sets up the Stage-Storage input table for your contour entries.
Note: At this point you may paste data directly into the Table. See Copying and Pasting Contour Data below.

Stage
Type in the stage value. The first stage value is always 0 and will be skipped. Your first entry will be the first contour elevation.
Press the [Tab] key to move to the next column – Elevation.
Elevation
Type the elevation corresponding to this stage. In most cases the program computes this value based on the Stage and displays it as a default. Simply press [Tab] to accept and proceed to the next item.
Contour Area
Type the contour area corresponding to this stage.
Press the [Tab] key to move to the next row of Stage, Elevation and Contour.
Repeat typing in Stage, Elevation and Contour Areas until you have reached the top of your pond. It is always wise to provide a little extra depth, or freeboard, to your pond.
Incremental Storage & Total Storage
Are automatically computed and displayed as a default. Note these items are zero at stage zero.
IMPORTANT
- You are not required to enter data for all of the available 20 stages, but at least three are required. The more you enter however, the more precise your final product will be.
- When you are finished entering data, click the [Apply Contours] button near the bottom right of the table.
A completed input table will look similar to the following:

Copying and Pasting Contour Data
The software allows you to paste data that you previously copied to the Windows Clipboard, directly into the Table. It allows the Elevations and corresponding Contours, for up to 20 pairs. The data must be in the format as shown below.
The first value is the Elevation and the second is the Contour. Must be separated by a tab character. Delimiters such as commas or spaces will not paste properly. The table below shows Elevations and Contours in an Excel Spreadsheet. Simply select the rows and columns containing the data and copy it to the Windows clipboard. Only include the numbers, do not include column header names.
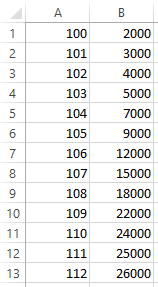
Once you have clicked the [Apply] button specifying the Bottom Elevation, Voids and Volume Calculation method, you can right-click anywhere on this Table. Then select “Paste | Elevation | Contour | data.

The Table will populate with your data. Incremental Storage and Total Storage will be computed as well.
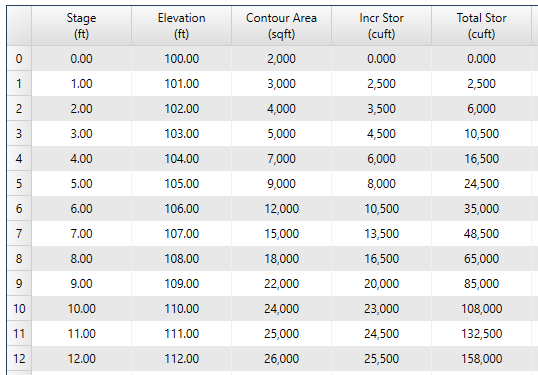
When you are finished entering data, click the [Apply Contours] button near the bottom right of the table.
Inserting and Deleting Rows
You can also insert and delete rows in your Contours table.
Delete Row – Right click on the row you wish to delete and select Delete Row. The row will be deleted.
Insert Row – Right-click on the row you wish to insert and select Insert Row. A new blank row will be inserted. Enter the new Stage; tab over to the Contour Area column and enter the new Contour Area.
When you are finished entering data, click the [Apply Contours] button near the bottom right of the table. The software will update the Stage-Storage data.
Plan & Profile Charts
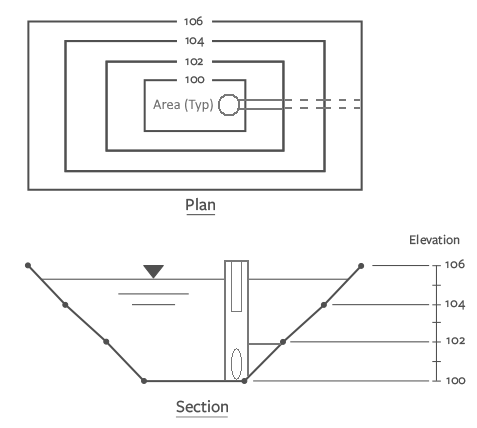
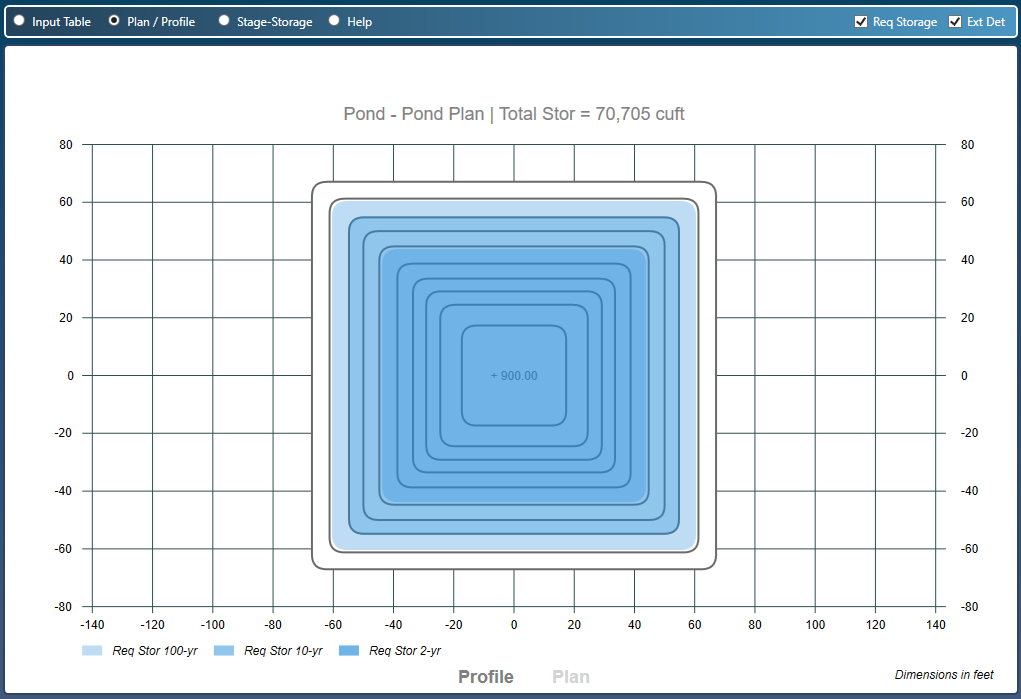
After entering your contours and clicking [Apply Contours], you will be able to see a plan and profile of the pond for visual verification.
Please be aware that the software defaults to a box shape for the pond, as it does not have, or need, information about its true form. Nevertheless, the actual shape will not influence your results or calculations. The key factors are the contour “areas” and their associated “elevation.” The Stage-Storage curve remains consistent regardless of the shape. Refer to the Stage-Storage chart below.
Click on the Plan / Profile radio option button to view.
Stage-Storage Chart
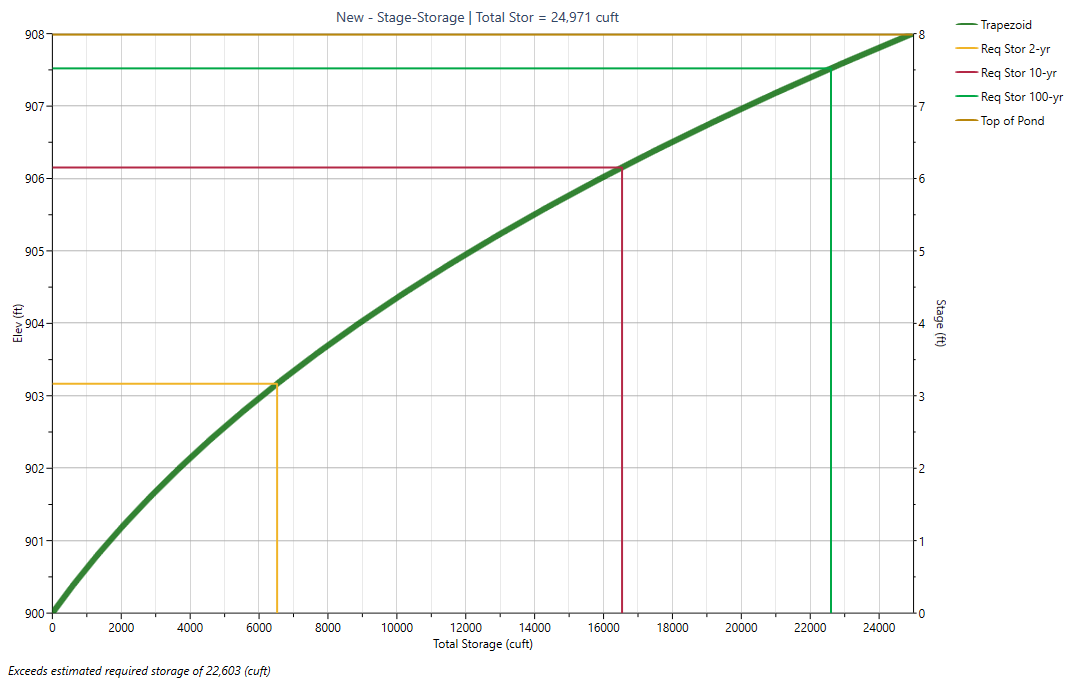
You can quickly view a chart of the Stage-Storage by clicking the Stage-Storage radio button. Notice in the chart below how the estimated required storage(s) from Step 1 are plotted. The lines provide you with the corresponding elevations at each return period. For example, the estimated storage for the 100-yr event requires that it fill the pond up to elevation 907.5.
Now click the [Outlet Struct] button to proceed to Step 3 – Outlets.
