It is crucial to have a clear understanding of the fundamental “calculation process” when conducting detention pond routings. This knowledge will enable you to effectively troubleshoot any issues that may arise from the results obtained. This article is not about the inputs for performing a pond routing in Hydrology Studio but rather helping you get a better feel for the procedures taking place behind the scenes, so-to-speak.
The Storage-Indication Method, which is utilized by Hydrology Studio, is widely recognized as the most commonly used approach for determining the necessary storage volume in detention basins. This routing procedure follows an iterative process based on the Continuity Equation.
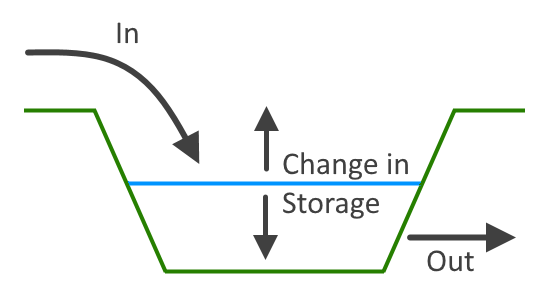
The basic premise is that, over a given time interval, the volume of water entering the pond minus the volume of water leaving the pond equals the remaining storage volume.
To put it simply, at any given point in time along the inflow hydrograph, the remaining storage is determined by subtracting the outflow from the inflow. This process commences at time zero and progresses in increments equal to the Time Interval, typically ranging from 1 to 6 minutes, until the entire duration of the inflow hydrograph is accounted for.
The method commences with establishing a stage-storage relationship and a stage-discharge relationship, which essentially involve creating a pond with an outflow device. The stage-storage relationship indicates the volume or storage present in the pond at a specific depth or stage, while the stage-discharge relationship informs us about the amount of flow exiting the pond at a given depth or stage. To this we add an inflow hydrograph and the following equation:

Where:
I = inflow volume
O = outflow volume
ds/dt = change in storage volume
Performing a Simple Pond Routing
To perform a routing you need three things as described above:
- Inflow hydrograph (just one)
- Stage vs. Storage relationship
- Stage vs. Discharge relationship
Lets examine these one-by-one.
Inflow Hydrograph
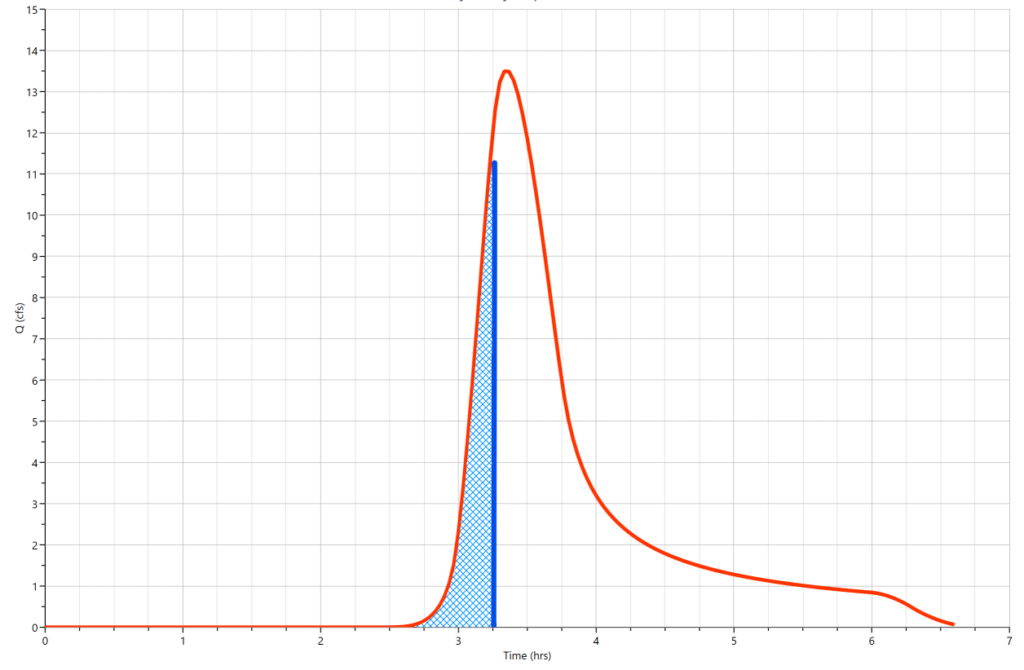
Below is a simple hydrograph that will be used for a pond routing inflow. Now lets take a time span, for example from 0 hours to 3.25 hours depicted by the blue vertical line, and calculate the volume (blue shaded area) up to the blue line. It’s 8,000 cuft. In other words, 8,000 cuft of runoff has accumulated at 3.25 hours into the storm.
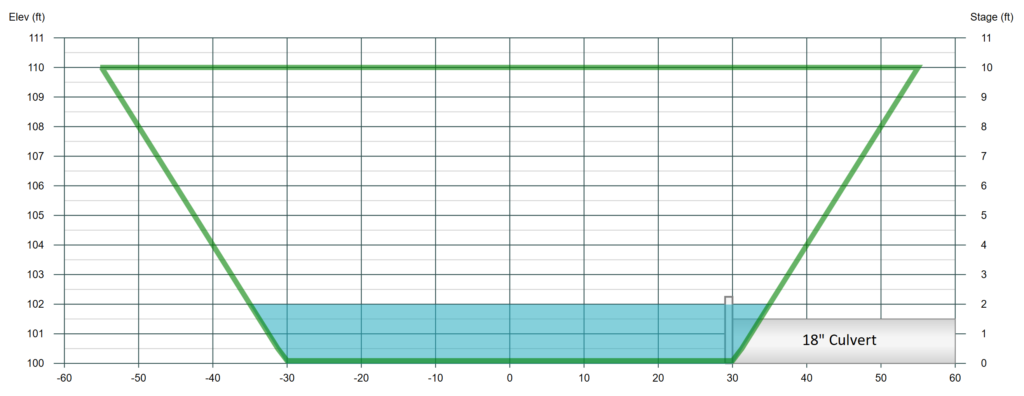
Stage vs. Storage Relationship
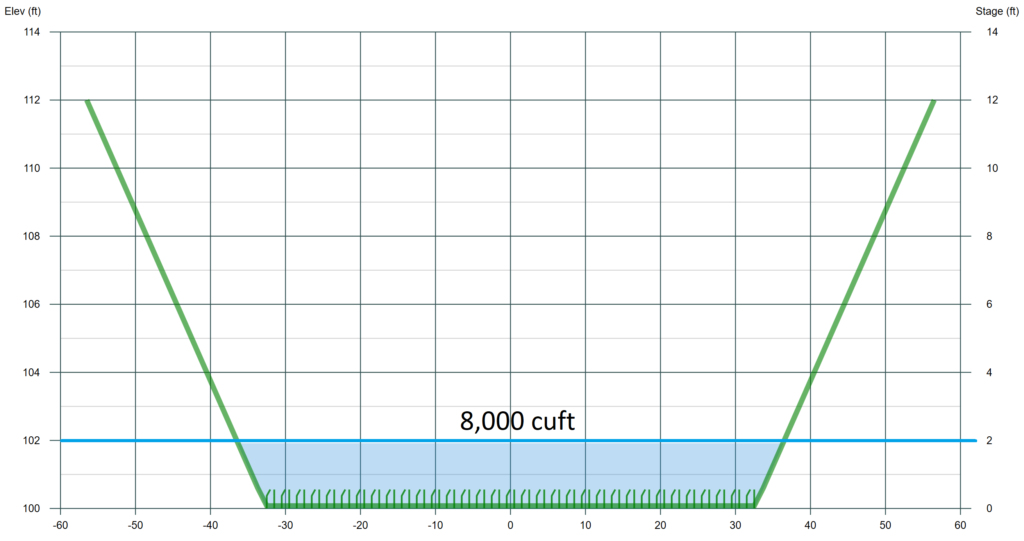
In order to proceed, it is necessary to have a physical detention pond and determine its capacity at different depths or elevations, which we refer to as Stage. Stage represents the exact distance between the water surface and the bottom of the pond. At this juncture, we are curious to know the Stage in the pond if we were to pour 8,000 cubic feet of water into it. The Stage-Storage curve provides us with this information.
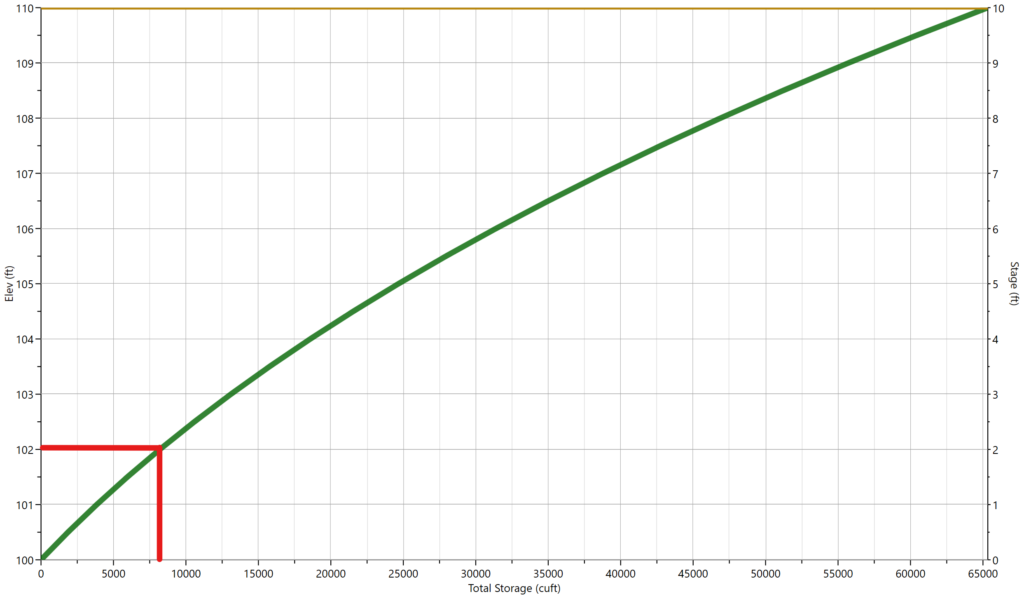
Above is our Stage vs. Storage curve for this particular detention pond. The green line represents the storage provided at any given elevation or Stage. When we added the 8,000 cuft of water, the water surface rose to Stage 2 ft or elevation 102.00 ft.
Stage vs. Discharge Relationship
Now that we know how deep the water is from the 8,000 cuft, we next need to find out how much water will in-turn exit the pond due to this 2 feet of depth. Below is our Stage vs. Discharge curve for this pond which contains a single 18-inch culvert placed at the bottom.
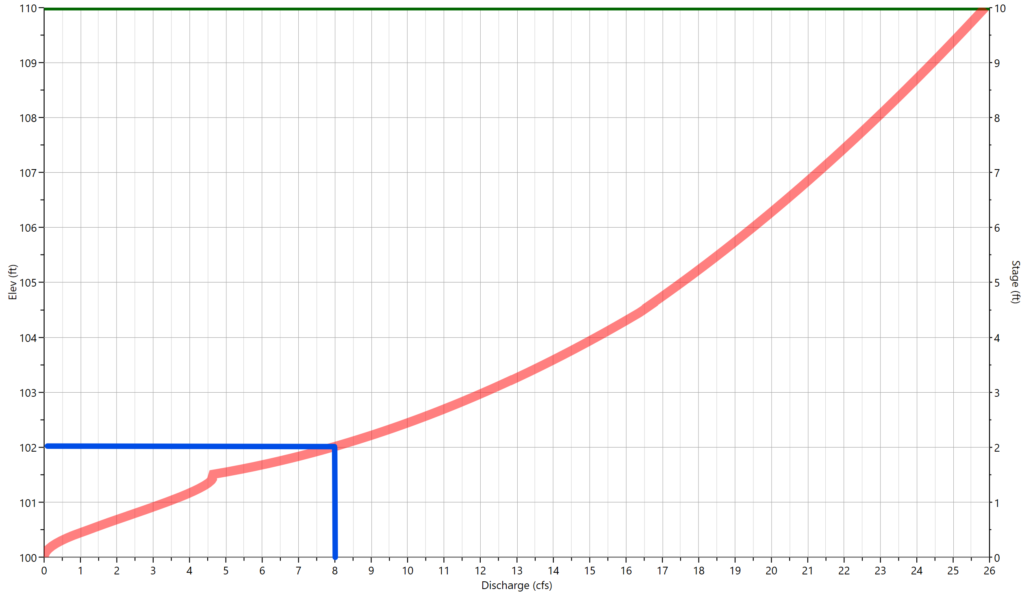
It indicates that the outflow at this depth (head against the culvert) will be 8 cfs. So whenever the pond has 8,000 cuft of water in it, it will release 8 cfs. It takes both a Stage vs. Storage curve and Stage vs. Discharge curve to know this.
So once we know the relationship between the inflow volume from the runoff hydrograph and the flow out of the pond, we can monitor this across each individual time step, dt or Time Interval as its called, and produce the final outflow hydrograph. We will also know the volume in the pond at any point along the way. This is what the Storage-Indication calculation method provides.
The Final Outflow Hydrograph
Below is the final outflow hydrograph which peaks at about 10 cfs. The maximum volume stored in the pond is the difference between the inflow hydrograph (blue line) and the outflow hydrograph (red) from the beginning up to the peak of the outflow hydrograph.
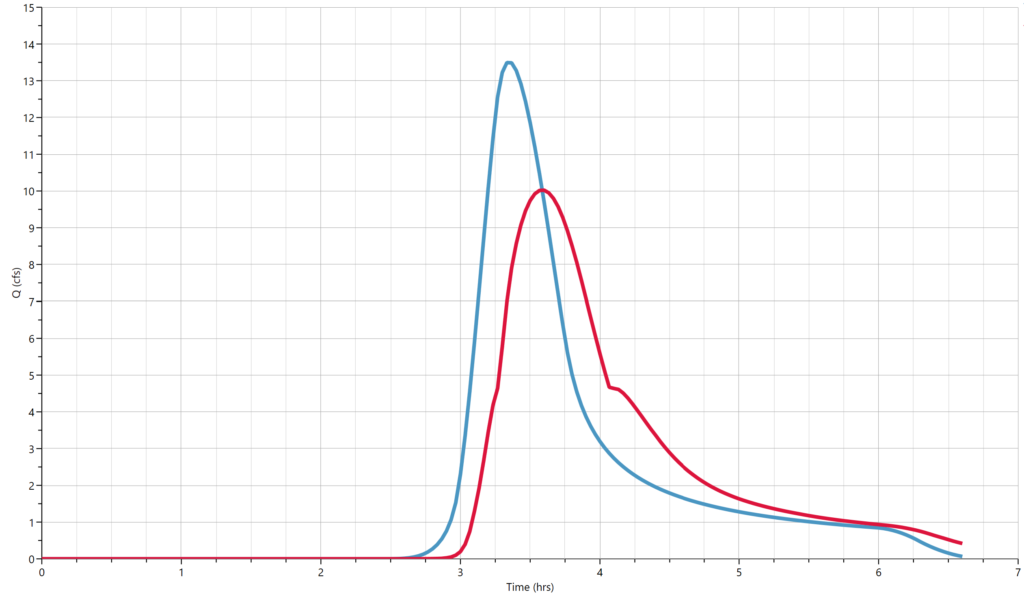
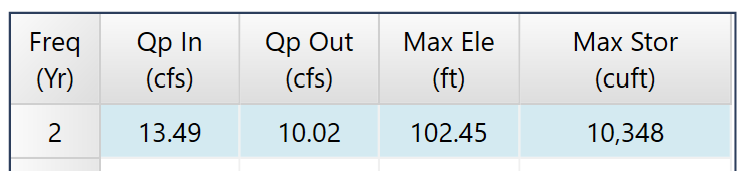
If you cross-reference the 10 cfs peak Q on the outflow hydrograph with the Stage-Discharge curve, you’ll see that it corresponds to an elevation of about 102.50 ft. Cross-reference that on the Stage-Storage curve and you’ll see that the maximum storage used was about 10,000 cuft. Sure enough, this is what is shown (10,348) in Hydrology Studio’s Trial Routing results.
It is crucial to emphasize that the peak time of the outflow hydrograph consistently aligns with a specific location on the inflow hydrograph, where the two hydrographs meet. At this juncture, the volume of water entering the pond matches the volume exiting. Should the inflow exceed the outflow, the pond will experience an increase in water level. Conversely, if the outflow surpasses the inflow, the water surface of the pond will decrease.
Troubleshooting Pond Routings
You may, from time-to-time, encounter errors during your routings. It is recommended to always inspect the stage-storage curve as well as the stage-discharge curve when adding your outlet structures. Make sure that the graph contains your target Qs. The following items are the most common culprits when pond routings fail.
- There is water exiting the pond at Stage zero. Be sure that your outlet devices are not discharging at the pond bottom. Q must be zero at Stage zero. Remember, In – Out = ds. In this scenario, In – Out is negative and we cannot have negative change in storage (ds).
- The Target Q you are looking for is not present on the Stage vs. Discharge curve. Please examine your Stage vs. Q curve to see if your Target Q is indicated anywhere. If it is absent, achieving your desired outcomes will be impossible. For instance, in the Stage vs. Q curve provided above, the outflows vary from zero to 26 cfs. If your Target Q is set at 28 cfs, successful routing will not be attainable. The water surface will reach the maximum level of your pond before it can discharge 28 cfs, as it can only release up to 26 cfs. The same principle applies to storage..
- The pond does not have sufficient storage. During the calculations the sum totals of ds exceeded the available storage in the pond. Try making your pond larger. Verify that your pond actually meets the estimated storage requirement.
- The Time Interval is too large. This can cause too much granularity in the calculations when working with very small flows, < 1 cfs. This results typically in a Qp Out being larger than the Qp In. Try reducing the Time Interval to 1 minute.
- No matter how large you make your pond, you can’t seem to make the routing work. This is more common with underground detention. Take a look at the pond’s total depth; translation… total head. If the total available head is small it will be difficult to achieve any significant discharge. Make your pond deeper to increase the head against your outlet device(s).
- There’s no flow out of your pond during the routing. This may be due to the outlet devices being set above the pond bottom. The storage volume between the pond bottom and the outlet device(s) invert is greater than the volume of the inflow hydrograph.
More On Troubleshooting Pond Routings
More insights about how to troubleshoot a failing detention pond routing can be found in this article.