Rather than type in each and every rainfall value, Hydrology Studio offers a way to import this data directly into your Precipitation table. Provided your state is one which is listed on this atlas (most are), you can quickly import this data by first downloading it from NOAA’s Precipitation Frequency Data Server. Follow these steps:
- Download the rainfall data from NOAA
- Import it Into Hydrology Studio’s Rainfall Wizard
Download the Rainfall File from NOAA
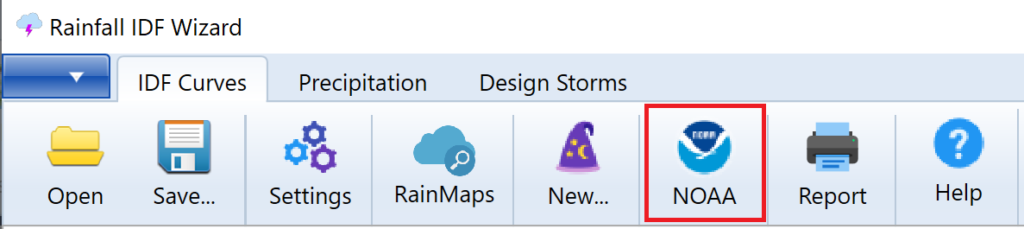
To start, click the [NOAA] button on the Rainfall Wizard’s Ribbon Toolbar to open the web server. (If you haven’t already opened the Rainfall Wizard window, click the [Rainfall] button on the Main Window to open the Rainfall Wizard.)
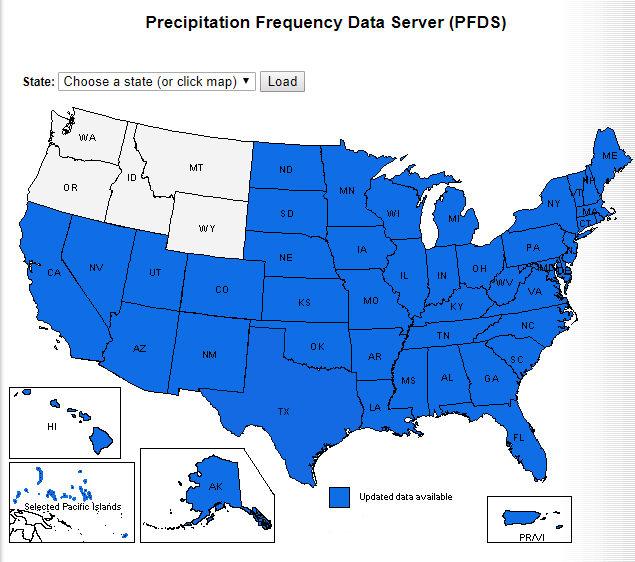
Then click on your state and move the red cross hair to your exact location. Not all states in the Pacific Northwest are included in NOAA. Progress is being made. Be sure to check back periodically at the NOAA site for updates.
A table at the bottom of that window will populate with your rainfall data. And at the bottom of the table you’ll see an option to download it as a .csv file.

Click [Submit]. You’ll see one of the following:

Import Into Hydrology Studio
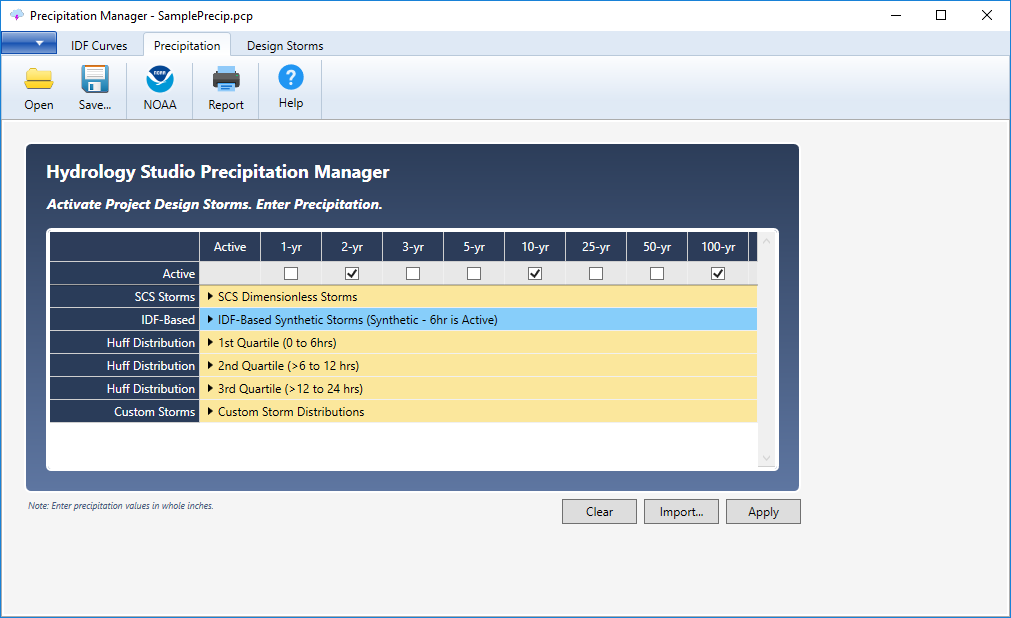
Next, back at the Rainfall Wizard, click on the Precipitation tab to view the Precipitation Manager. Clear all of the values from the table by clicking the [Clear] button. Then click the [Import] button and select “NOAA Atlas 14”.
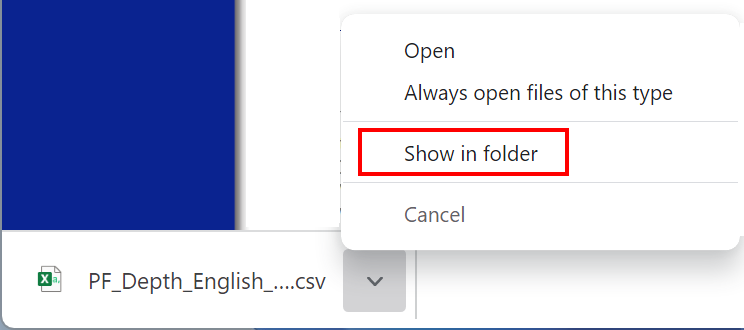
Select the file you just downloaded from NOAA and click [Open].
Click [Apply].
All of the precipitation amounts corresponding to the built-in storms will now show data for your selected location.
Save your new data by clicking the [Save] button and specifying a name for your file. A “.pcp” extension will applied.
This .pcp file will automatically load each time you launch Hydrology Studio. Any NRCS-type hydrographs will use this rainfall data. There’s no need to return back to this window unless you need to change locations. You can change this file any time afterwards.
Click the [Open] or [Save] buttons to open or save an existing .pcp file.
Does Not Populate Custom, FDOT or Austin Storm Distributions
Please note that the import feature will not populate the precipitation values on Custom Distributions as the program does not know the total durations of those storms. The import function only applies to the standard storms. Custom, FDOT and Austin Storm precipitations will need to be entered manually in the Rainfall Wizard.
File Contents
The file will open in your web browser, or other text viewer, and will look similar to the following:
Point precipitation frequency estimates (inches)
NOAA Atlas 14, Volume 1, Version 5
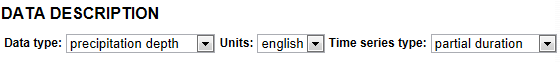
Data type: Precipitation depth
Time series type: Partial duration
Project area: Southwest
Latitude (decimal degrees): 34.4000
Longitude (decimal degrees): -111.7000
PRECIPITATION FREQUENCY ESTIMATES
by duration for ARI:, 1,2,5,10,25,50,100,200,500,1000 years
5-min:, 0.24,0.31,0.42,0.51,0.64,0.74,0.85,0.97,1.15,1.29
10-min:, 0.37,0.48,0.65,0.78,0.97,1.13,1.30,1.48,1.75,1.97
15-min:, 0.46,0.59,0.80,0.97,1.21,1.40,1.61,1.84,2.17,2.44
30-min:, 0.62,0.80,1.08,1.30,1.62,1.89,2.17,2.48,2.92,3.28
60-min:, 0.76,0.98,1.33,1.61,2.01,2.34,2.69,3.07,3.61,4.06
2-hr:, 0.89,1.14,1.50,1.80,2.24,2.60,2.99,3.41,4.03,4.54
3-hr:, 0.98,1.24,1.59,1.90,2.33,2.68,3.07,3.50,4.12,4.63
6-hr:, 1.20,1.50,1.86,2.18,2.64,3.01,3.41,3.84,4.44,4.95
12-hr:, 1.49,1.85,2.27,2.62,3.09,3.46,3.85,4.23,4.79,5.26
24-hr:, 1.82,2.28,2.85,3.31,3.94,4.43,4.94,5.47,6.18,6.74
2-day:, 2.17,2.71,3.39,3.95,4.71,5.32,5.95,6.60,7.49,8.18
3-day:, 2.33,2.91,3.65,4.25,5.09,5.75,6.43,7.15,8.12,8.90
4-day:, 2.49,3.12,3.91,4.56,5.46,6.17,6.92,7.70,8.76,9.61
7-day:, 2.90,3.62,4.52,5.25,6.26,7.05,7.88,8.72,9.89,10.80
10-day:, 3.23,4.03,5.00,5.76,6.79,7.58,8.38,9.19,10.30,11.16
20-day:, 4.15,5.17,6.32,7.18,8.28,9.08,9.87,10.62,11.57,12.26
30-day:, 4.96,6.18,7.55,8.58,9.88,10.83,11.76,12.65,13.77,14.58
45-day:, 5.96,7.44,9.11,10.38,12.02,13.23,14.42,15.58,17.06,18.14
60-day:, 6.81,8.50,10.35,11.72,13.45,14.70,15.91,17.06,18.49,19.52
Date/time (GMT): Thu May 3 18:02:02 2012
pyRunTime: 0.0390179157257