Rather than manually type in the intensity amounts into your rainfall file, you can import them and save yourself lots of time. Provided your state is one which is listed on NOAA Atlas 14, (most are) you can quickly import IDF curves by first downloading it from NOAA’s Precipitation Frequency Data Server. This creates a .csv file which will be used to import.
Download the Rainfall File from NOAA
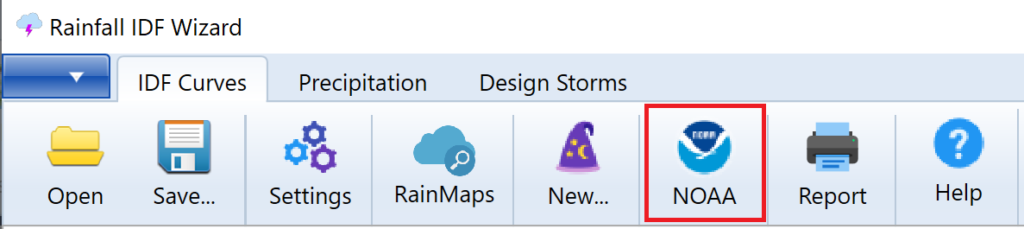
To start, open the Rainfall Wizard by clicking the Rainfall button from the Main Window – Rainfall tab. Next, click the [NOAA] button on the Ribbon Toolbar in the Rainfall Wizard to open the NOAA web server.
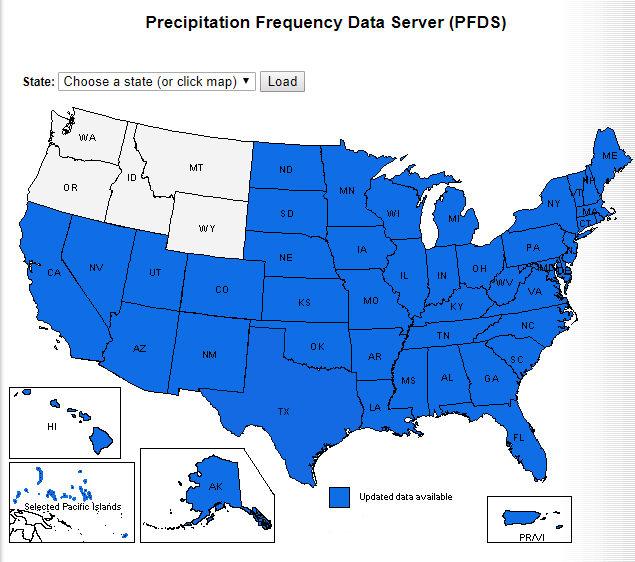
Then click on your state.
Then move the red location marker to your exact location in the state you selected. A table will be populated at the bottom of that screen with the corresponding IDF data. At the bottom of the table you’ll see an option to export as a .csv file.

Click [Submit]. You’ll see one of the following options:

Import Into Hydrology Studio
Now that you have downloaded your data file, you’re ready to import your IDF curves. Next, in the Rainfall Wizard, click the [New…] button on top.
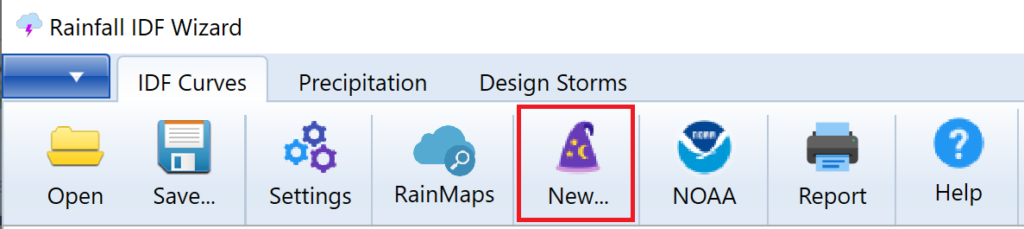
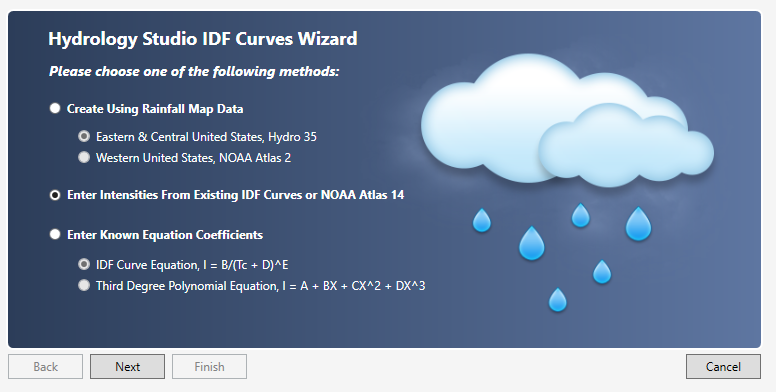
This opens the IDF Wizard shown below. Choose option 2, Enter Intensities from Existing IDF Curves or NOAA Atlas 14 and click [Next].
Next, clear all of the values from the table by clicking the [Clear] button. This will turn all of the table’s numbers to zero. Then click the [Import] button on the IDF Curves Wizard screen and select “NOAA Atlas 14”.
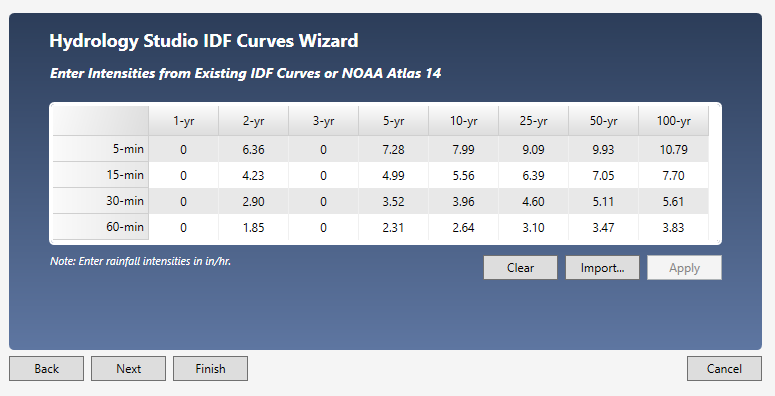
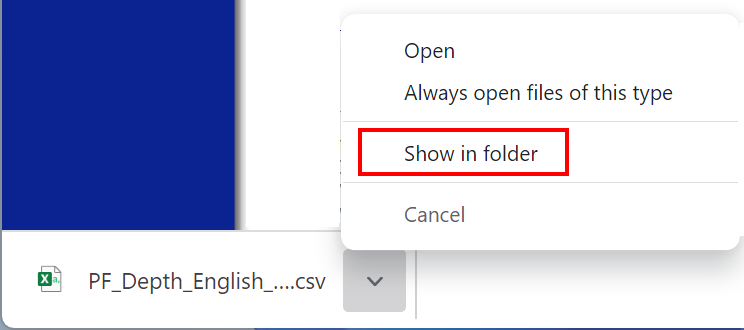
Select the .csv file you just downloaded from NOAA and click [Open].
Then click [Apply].
Click [Next] if you want to edit Correction Factors. Otherwise, click [Finish].
You’ll be taken back to the initial IDF Wizard screen where you’ll see your new IDF curves.
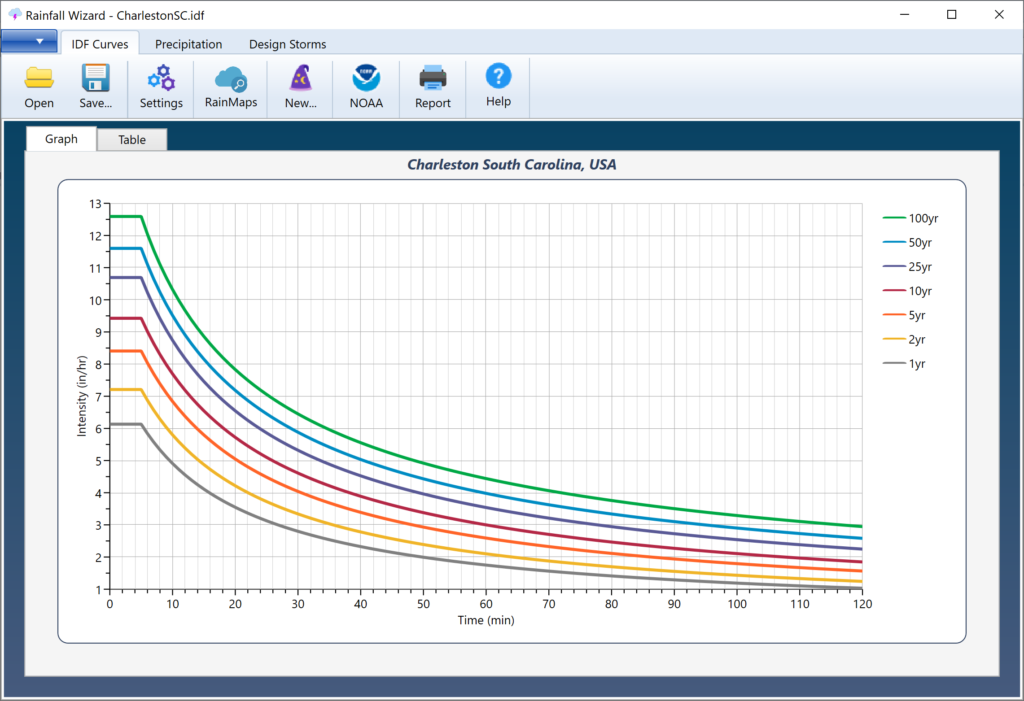
Save your curves by clicking the [Save] button and specifying a name for your file. An IDF extension will be applied. This file will automatically open each time you launch Hydrology Studio. You can, of course, change this file any time afterwards.
Troubleshooting IDF Curves
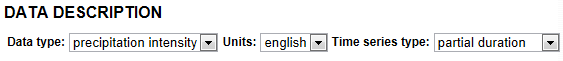
If the import fails and you receive the message, “This file is in the wrong format”, it may indicate that you have selected Precipitation depth instead of Precipitation intensity as the data type in NOAA. This can also be the result of opening and resaving the csv file in Excel, which will modify the file contents.
NOAA Atlas 14 Data May Require Smoothing
There may be occasions when the resulting curves do not exactly match the imported data. The software manipulates, or smooths, your input data to generate coefficients B, D & E, for use in an Intensity vs. Tc equation. In other words the data must plot straight on log/log scale. If it does not, the software will make adjustments to the data using a smoothing technique, so that the data fits the equation.
These adjustments are always within the lower and upper bounds of the 90% confidence interval as shown on the NOAA data tables. Keep in mind that NOAA generates this data from interpolating data points on a GIS grid and this will produce some irregularity as described below.
Each duration in NOAA Atlas 14 was analyzed separately. For example, the 30-minute value for each frequency was extracted and analyzed for precipitation-frequency. Then the 60-minute value for each frequency was extracted and analyzed for precipitation-frequency. And so-on. Each value has a calculated mean, standard deviation, and skew. So what’s interesting is that no attempt was made to smooth these data across the series of durations for each return period. Thus the NOAA data will exhibit some irregularities.
You can make adjustments to the derived coefficients yourself in order to sway the curve in one direction or the other. For example, if the fitted curve is higher than the original data, adjust the D coefficient upwards until you are satisfied with the results. Do this by following the procedures here.
Creating Your Own Rainfall Equation Coeficients
If it is crucial for your data to exactly align with the original data points, you can employ the charting capabilities in Microsoft Excel. By doing so, you can generate your own coefficients for use in Hydrology Studio’s Third-degree Polynomial equation. Please see this article for instructions.
File Contents
If you open this file in your web browser, or other text viewer, it will look similar to the following:
Point precipitation frequency estimates (inches/hour)
NOAA Atlas 14, Volume 2, Version 3
Data type: Precipitation intensity
Time series type: Partial duration
Project area: Ohio River Basin
Latitude (decimal degrees): 33.8000
Longitude (decimal degrees): -81.0000
PRECIPITATION FREQUENCY ESTIMATES
by duration for ARI:, 1,2,5,10,25,50,100,200,500,1000 years
5-min:, 5.51,6.37,7.26,8.17,9.19,10.04,10.86,11.65,12.62,13.51
10-min:, 4.40,5.09,5.81,6.54,7.32,8.00,8.63,9.23,9.98,10.64
15-min:, 3.66,4.27,4.90,5.52,6.18,6.76,7.27,7.77,8.38,8.90
30-min:, 2.51,2.95,3.48,4.00,4.58,5.09,5.57,6.05,6.66,7.21
60-min:, 1.57,1.85,2.23,2.60,3.05,3.45,3.83,4.24,4.78,5.26
2-hr:, 0.90,1.07,1.30,1.54,1.83,2.10,2.37,2.67,3.06,3.43
3-hr:, 0.63,0.75,0.92,1.10,1.32,1.53,1.75,1.98,2.32,2.63
6-hr:, 0.38,0.45,0.55,0.65,0.79,0.91,1.05,1.19,1.40,1.60
12-hr:, 0.22,0.26,0.32,0.38,0.46,0.54,0.62,0.72,0.85,0.97
24-hr:, 0.12,0.15,0.19,0.22,0.27,0.32,0.36,0.42,0.50,0.57
2-day:, 0.07,0.09,0.11,0.13,0.16,0.18,0.21,0.24,0.28,0.32
3-day:, 0.05,0.06,0.08,0.09,0.11,0.13,0.14,0.16,0.19,0.22
4-day:, 0.04,0.05,0.06,0.07,0.09,0.10,0.11,0.13,0.15,0.17
7-day:, 0.03,0.03,0.04,0.05,0.06,0.06,0.07,0.08,0.09,0.10
10-day:, 0.02,0.03,0.03,0.04,0.04,0.05,0.05,0.06,0.07,0.08
20-day:, 0.01,0.02,0.02,0.02,0.03,0.03,0.03,0.04,0.04,0.04
30-day:, 0.01,0.01,0.02,0.02,0.02,0.02,0.03,0.03,0.03,0.03
45-day:, 0.01,0.01,0.01,0.02,0.02,0.02,0.02,0.02,0.02,0.02
60-day:, 0.01,0.01,0.01,0.01,0.01,0.02,0.02,0.02,0.02,0.02
Date/time (GMT): Tue OCT 20 20:02:01 2017
pyRunTime: 0.0222988128662