Hydrology Studio can import precipitation data directly from the Australian Government Bureau of Meteorology (BOM) web server. The process involves selecting a single-point location from a map and getting the latitude and longitude coordinates. From that, the web server will produce the required data from which you will save as a .csv file. This file can then be read and imported by Hydrology Studio.
Acquire Data From BOM
Begin by visiting the Bureau of Meteorology website.
Select “Single Point” option to open the following screen:
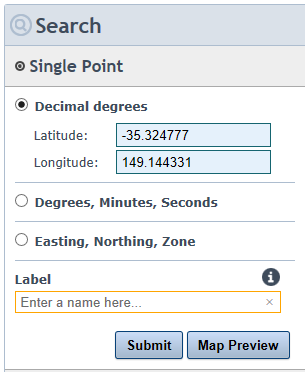
Using a separate tab in your browser, open Google Maps and identify your location. Then right-click to open “What’s here” menu. Copy and paste the coordinates, or enter directly, into the Latitude and Longitude fields.
Enter a meaningful name in the Label field and then click [Submit]. The server will acquire the data for that location and display it in a table. Keep the units to (mm) so that the Table looks like the following:
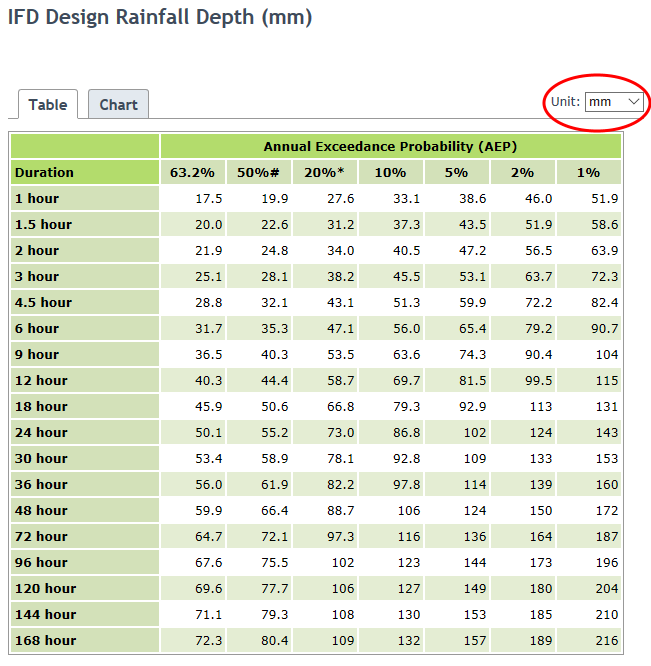
Next, Click the download icon on the upper right corner to save this data to a .csv file.
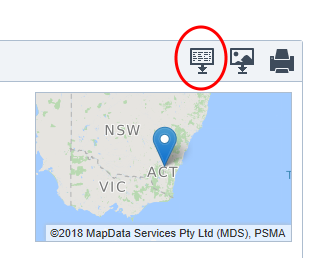
Save the csv file to your Hydrology Studio/Rainfall folder.
Import Data Into Hydrology Studio
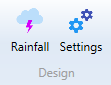
Now that you have created a data file, you’re ready to import your precipitation. Click the [Rainfall] button on the main window to open the Rainfall Wizard.
Then click the Precipitation tab.
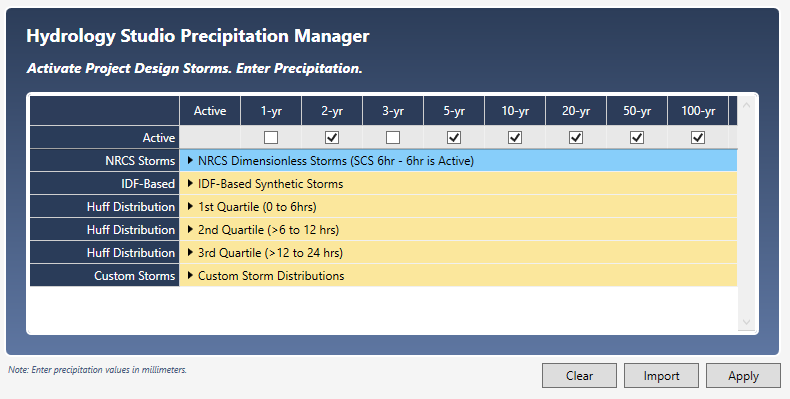
Next, clear all of the values from the table by clicking the [Clear] button. Then click the [Import] button on the Hydrology Studio Precipitation Manager screen and select “Australia Bureau of Meteorology”.
Select the file you just saved and click [Open].
Click [Apply].
Note that only the 6-hour and 24-hour durations will be imported. These will be entered under the NRCS (SCS) Dimensionless Storms category.
Save your new data by clicking the [Save] button and specifying a name for your file. A “.pcp” extension will applied. This file will automatically open each time you launch Hydrology Studio. You can, of course, change this file any time afterwards.
Click the [Open] or [Save] buttons to open or save an existing .pcp file.
File Contents
The csv file will open in any text viewer and will look similar to the following:
Copyright Commonwealth of Australia 2016 Bureau of Meteorology (ABN 92 637 533 532)
IFD Design Rainfall Depth (mm)
Issued:,17 November 2018
Location Label:,
Requested coordinate:,Latitude,-35.324777,Longitude,149.144331
Nearest grid cell:,Latitude,35.3125 (S),Longitude,149.1375 (E)
,,Annual Exceedance Probability (AEP)
Duration,Duration in min,63.2%,50%,20%,10%,5%,2%,1%
1 min,1,1.62,1.84,2.58,3.10,3.63,4.36,4.94
2 min,2,2.71,3.09,4.31,5.16,6.02,7.16,8.05
3 min,3,3.71,4.23,5.90,7.08,8.26,9.86,11.1
4 min,4,4.61,5.24,7.31,8.78,10.3,12.3,13.9
5 min,5,5.39,6.14,8.57,10.3,12.1,14.5,16.4
10 min,10,8.29,9.44,13.2,15.9,18.6,22.5,25.5
15 min,15,10.2,11.6,16.3,19.6,23.0,27.6,31.4
20 min,20,11.6,13.3,18.6,22.3,26.2,31.4,35.6
25 min,25,12.7,14.5,20.4,24.5,28.7,34.4,38.9
30 min,30,13.7,15.6,21.9,26.3,30.7,36.8,41.5
45 min,45,15.8,18.1,25.2,30.2,35.3,42.1,47.5
1 hour,60,17.5,19.9,27.6,33.1,38.6,46.0,51.9
1.5 hour,90,20.0,22.6,31.2,37.3,43.5,51.9,58.6
2 hour,120,21.9,24.8,34.0,40.5,47.2,56.5,63.9
3 hour,180,25.1,28.1,38.2,45.5,53.1,63.7,72.3
4.5 hour,270,28.8,32.1,43.1,51.3,59.9,72.2,82.4
6 hour,360,31.7,35.3,47.1,56.0,65.4,79.2,90.7
9 hour,540,36.5,40.3,53.5,63.6,74.3,90.4,104
12 hour,720,40.3,44.4,58.7,69.7,81.5,99.5,115
18 hour,1080,45.9,50.6,66.8,79.3,92.9,113,131
24 hour,1440,50.1,55.2,73.0,86.8,102,124,143
30 hour,1800,53.4,58.9,78.1,92.8,109,133,153
36 hour,2160,56.0,61.9,82.2,97.8,114,139,160
48 hour,2880,59.9,66.4,88.7,106,124,150,172
72 hour,4320,64.7,72.1,97.3,116,136,164,187
96 hour,5760,67.6,75.5,102,123,144,173,196
120 hour,7200,69.6,77.7,106,127,149,180,204
144 hour,8640,71.1,79.3,108,130,153,185,210
168 hour,10080,72.3,80.4,109,132,157,189,216