Depending on the drainage authority or authorities you are operating under, you may be required to conduct a Critical Storm Duration analysis. This analysis is designed to identify the design storm that produces the highest peak flow rate, either from a runoff hydrograph or through detention pond routing. It involves running your hydrology model using design storms of varying durations (and shapes), for example 1, 2, 4, 8, and 24 hours, across the 2, 10, and 100 – year return periods.
Navigating through five design storms, each at unique frequencies, can be quite time consuming. Thankfully Hydrology Studio is equipped to easily handle these tasks. The software is inherently capable of computing multiple frequencies simultaneously. And with this feature, it can perform this analysis for up to seven unique design storms, with a single click of a button.
Do not attempt to do this with a basin model containing Rational or Malcom methods. The Rational method duration is connected to the Time of Concentration (Tc). By definition, the Tc IS the critical duration for Rational method hydrographs. If your model does contain Rational method hydrographs, they will be ignored during this analysis.
How to Perform a Critical Duration Analysis
In short, once you have a working basin model with your desired return periods, simply open the Critical Duration window (CritDur button on the ribbon menu); select a group of design storms; click [Compute].
Within seconds, you’ll be presented with a table matrix that highlights the critical storms producing maximim Qs. Close the window to return to your main basin model. Reset the primary design storm to the critical storm on the Rainfall tab, and finish your work. That’s all you’ll need to do.
An Example
Lets work through an example from which you can follow and adapt to any other similar analysis. We will be using the Florida DOT design storms below but you can use other storms such as the Huff design storms.
In this example, we are required to find the storm duration from the 1, 2, 4, 8 and 24 hour duration storms prescribed by the Florida DOT, which maximizes the peak outflow from a post-development detention pond design for the 2, 10 and 100 – year return periods. You can use this feature on any Basin Model but keep in mind that only NRCS-type hydrographs apply. Again, it is not intended to use with Rational or Malcom hydrographs.
The example basin is shown below.
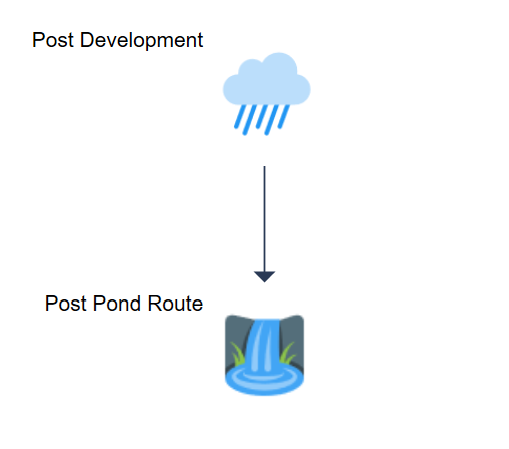
Follow these steps.
1. Select the Primary Design Storm
At this point we need to generate a working basin model before sending it over to the Critical Duration Analysis. In this case we will choose the Florida DOT – 1 hr design storm from the Rainfall tab. But we can use any design storm as the primary storm. You should also confirm the Return Periods you wish to use. The 2, 10 and 100-year events have been selected below.

Check Your Rainfall Data
In case you haven’t added the precipitation amounts to the FLDOT Storms, you should do that now.
Click on the [Rainfall] button to open the Precipitation Manager. Expand the FDOT grid by clicking on the little arrow. Then add the rainfall amounts for each design storm as shown below.

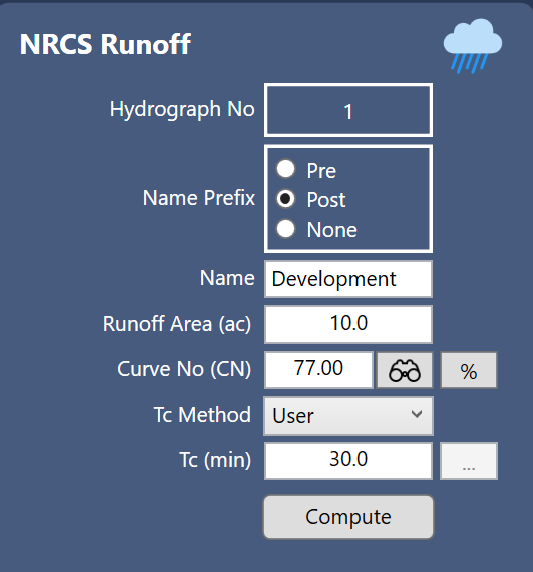
2. Compute the 1st Runoff Hydrograph
Next we will compute the NRCS runoff hydrograph. Select Hydrograph No. 1. Then enter the Name, Area, CN & Tc as shown below, and then Compute.
3. Perform the Pond Routing
Select the Route icon associated with this 1st runoff hydrograph (Hyd. No. 2). This example is going to skip the pond design details for simplicity, so you can stay focused on the Critical Storm Duration procedure. We will assume the pond has been created and is ready for a final routing.
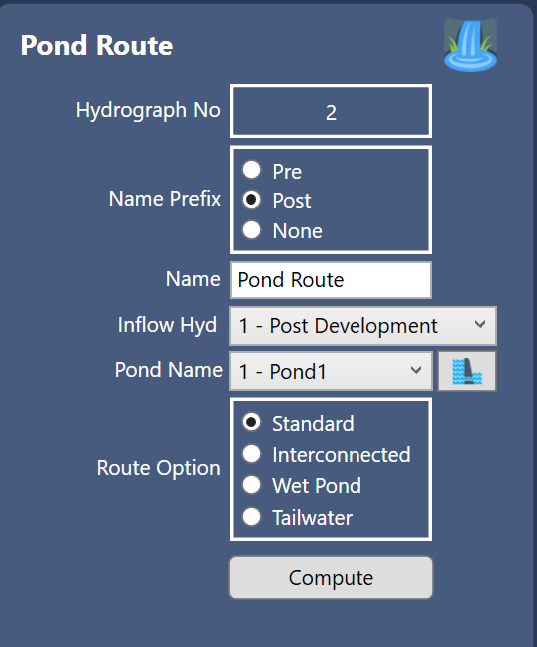
Enter a Name. Choose your pond and Compute.
4. Open the Critical Duration Window
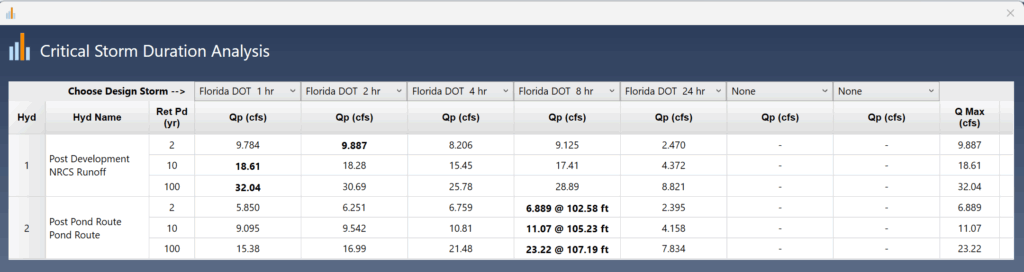
We have now created a working model that we can use to perform a critical duration analysis. Next, click the [Critical Duration] button on the ribbon menu to open the Critical Duration Analysis window shown below.
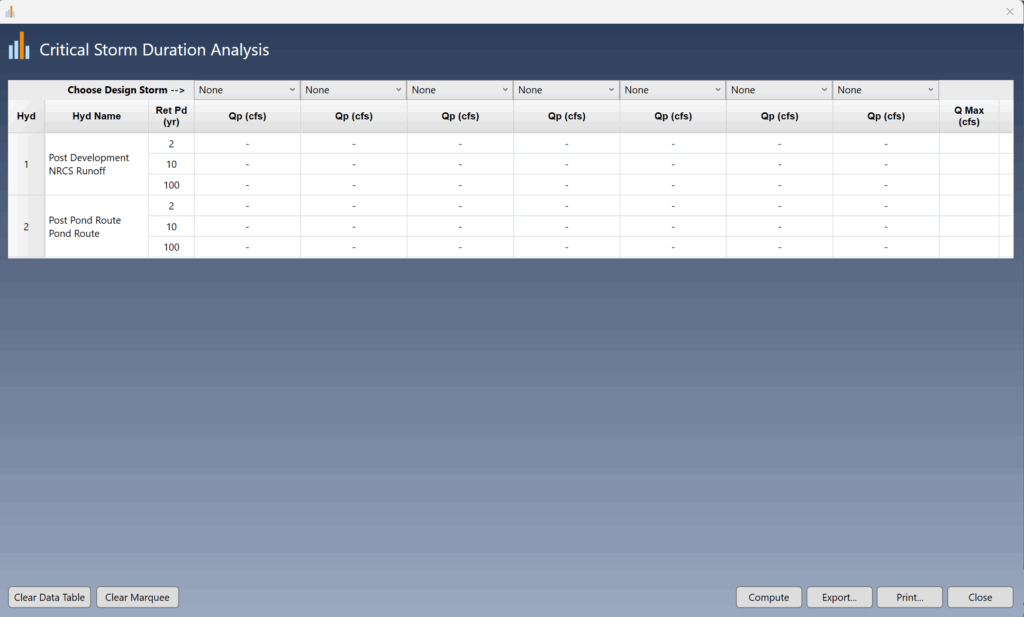
The Critical Duration Analysis screen displays a table containing all of the hydrographs in your model as well as the active return periods. A row across the top contains drop-down list boxes from which you will select your design storms. The default is None. Once selected, these design storms will be stored in the software’s Settings and will re-open on each launch.
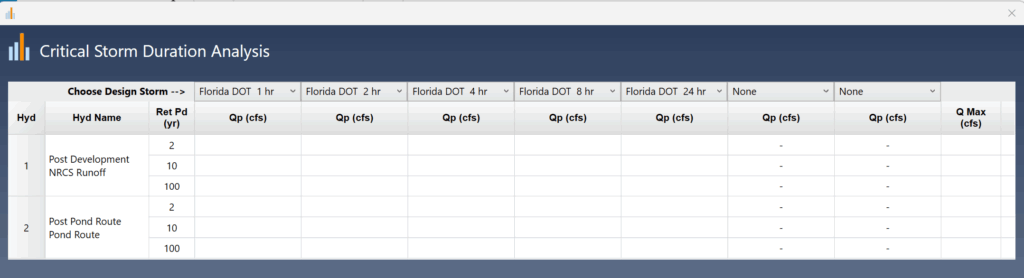
The Florida DOT 1, 2, 4, 8 and 24 hour durations were selected as shown below.
5. Identify the Critical Storm Duration
Click the [Compute] button at the lower right of this window. The results are shown below.
Parsing through the results grid reveals the 8-hour duration is the storm that produces the maximum outflow and stage across all frequencies for the pond routing. Note that the 24-hour duration produced the smallest peak Q on both runoff and pond routings. Peak Qs are shown in bold and are also displayed in a summary column on the right.
Other options in this feature allow you to Export the table to a .csv or txt file and print a formal report. Note that for space purposes, the formal report does not include the summary Q Max column.
Final Thoughts
The main reason for conducting a critical duration analysis is that the various design storms exhibit different shapes. For instance, the Huff storms, in contrast to the standard NRCS or nested Synthetic storms, display varying shapes across their four quartiles. These distinct shapes yield different outcomes based on the inputs. Therefore, it is essential to determine the storm that will generate the highest flow rates.
Additionally, it is important to recognize that a pond routed hydrograph with the highest peak outflow will produce the highest stage or elevation. Why is this the case? The Stage-Discharge curve consistently rises upwards and to the right. The higher the Discharge, the higher the Stage.