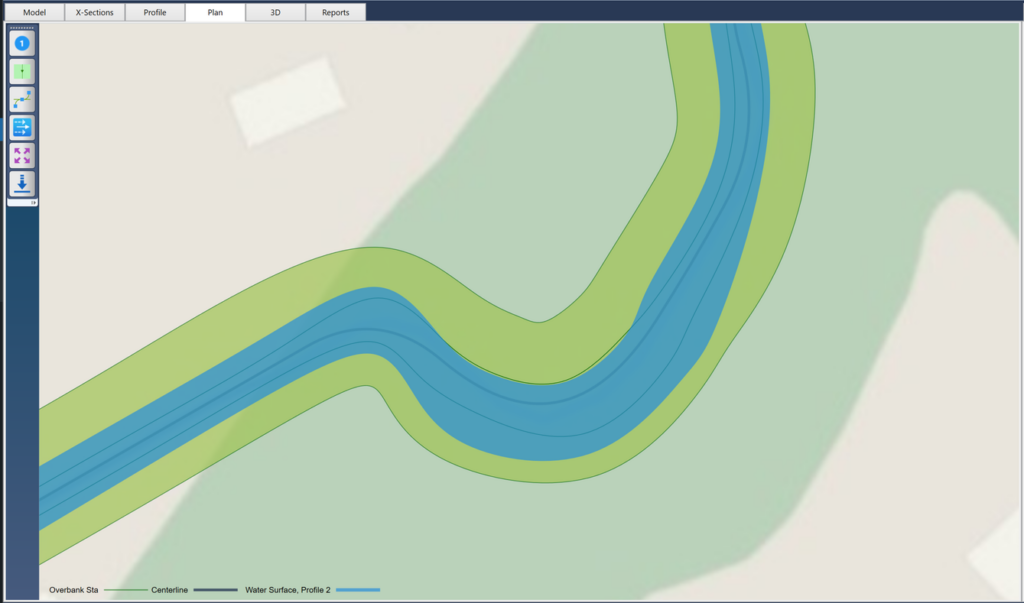
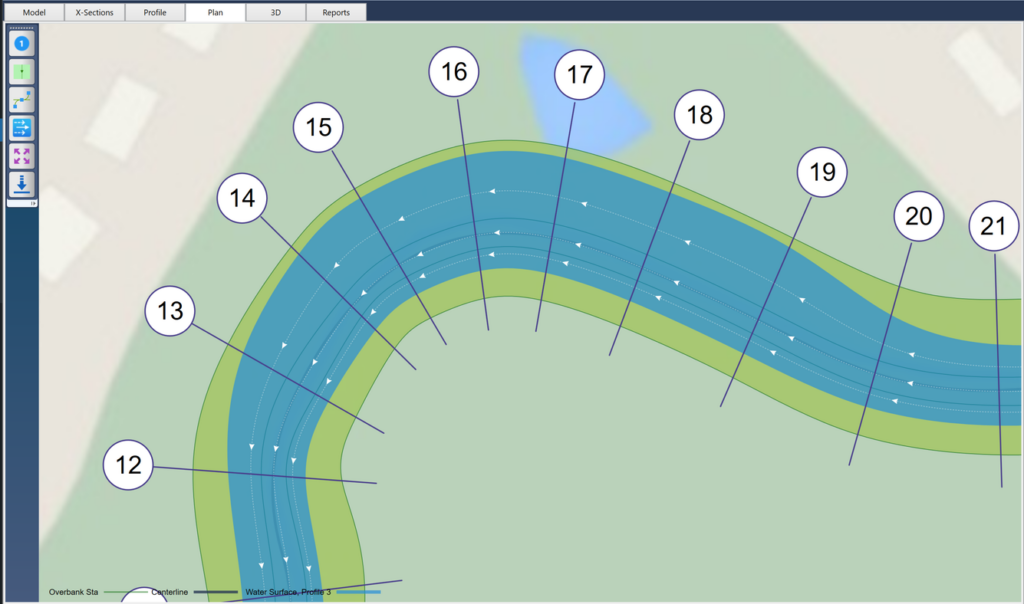
By merging the model layout and geometric cross-section data, Channel Studio automatically produces a coordinate-based plan view like the one shown below. To view this, click the Plan tab.
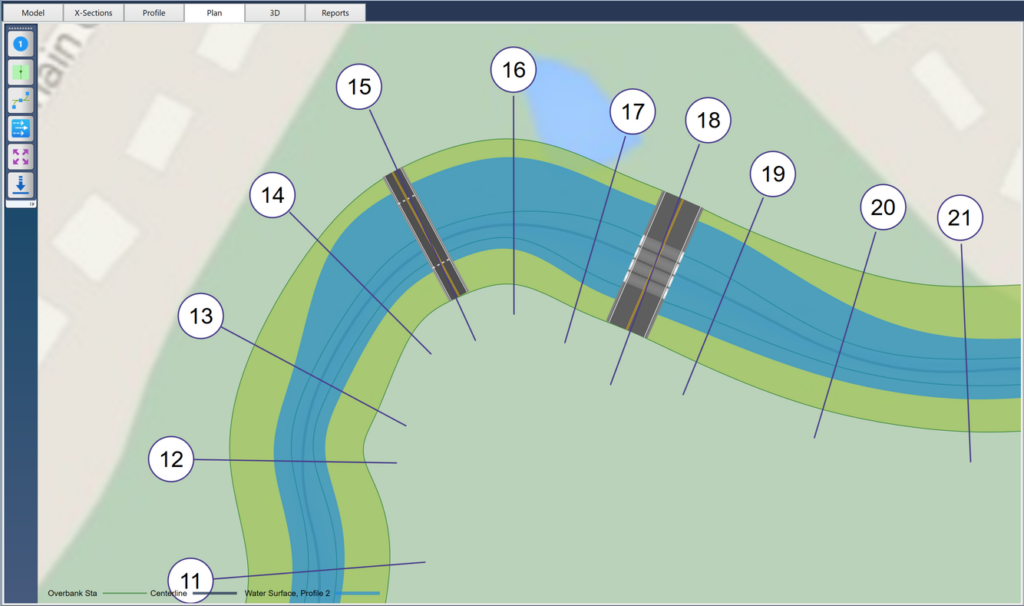
Plan maps can be exported for further processing. The green lines are the channel extents, overbanks and the channel centerline. If the inputs are current with the calculations, the water surface will be overlaid on top.
Like the Model view, you can zoom in/out using your mouse wheel. Pan by dragging your mouse in any direction.
Use the options located on the left to:
- Toggle on or off the cross-section labels
- Toggle on or off the Channel boundaries showing only the water surface
- Convert straight segments to smooth curves
- Include flow path streamlines for Channel, Right & Left Overbanks
- Zoom to the drawing extents
- Export the map to an image, DXF, LandXML TIN Surface or a RAS GIS file
Converting Straight Segments to Curves
The outer channel boundaries, overbank lines, water surface, and flow paths are capable of being represented as either curves or straight segments. This functionality utilizes advanced Bezier Curve algorithms to transform straight line segments into curves that maintain their original points.
Channel Studio typically plots your plan view by connecting points data at each cross-section. This results in plotting straight segments as shown below.

Although this approach is generally appropriate, it can be enhanced by representing those segments as curves, thereby offering a more authentic plan view.

Select the Straight-to-Curve option located on the side toolbar to create a more polished look by smoothing out the straight segments, as demonstrated in the image below.
Curved Segment Curling
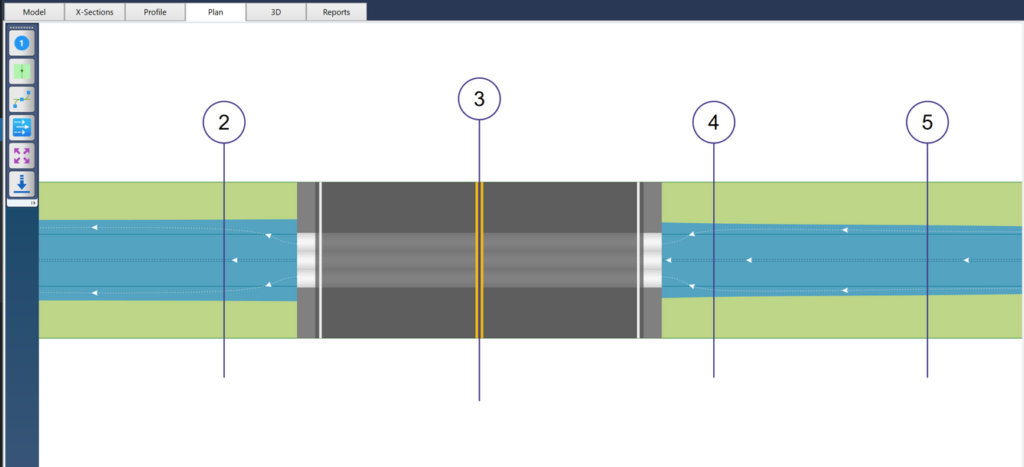
Channel Studio makes a significant effort to streamline channel segments, but there are instances where it may not convert smoothly. Due to the influence of both upstream and downstream segments on Bezier curves, achieving smoothness while maintaining the original points can be extremely challenging. The phenomenon illustrated below exemplifies this difficulty, known as “Curling.”
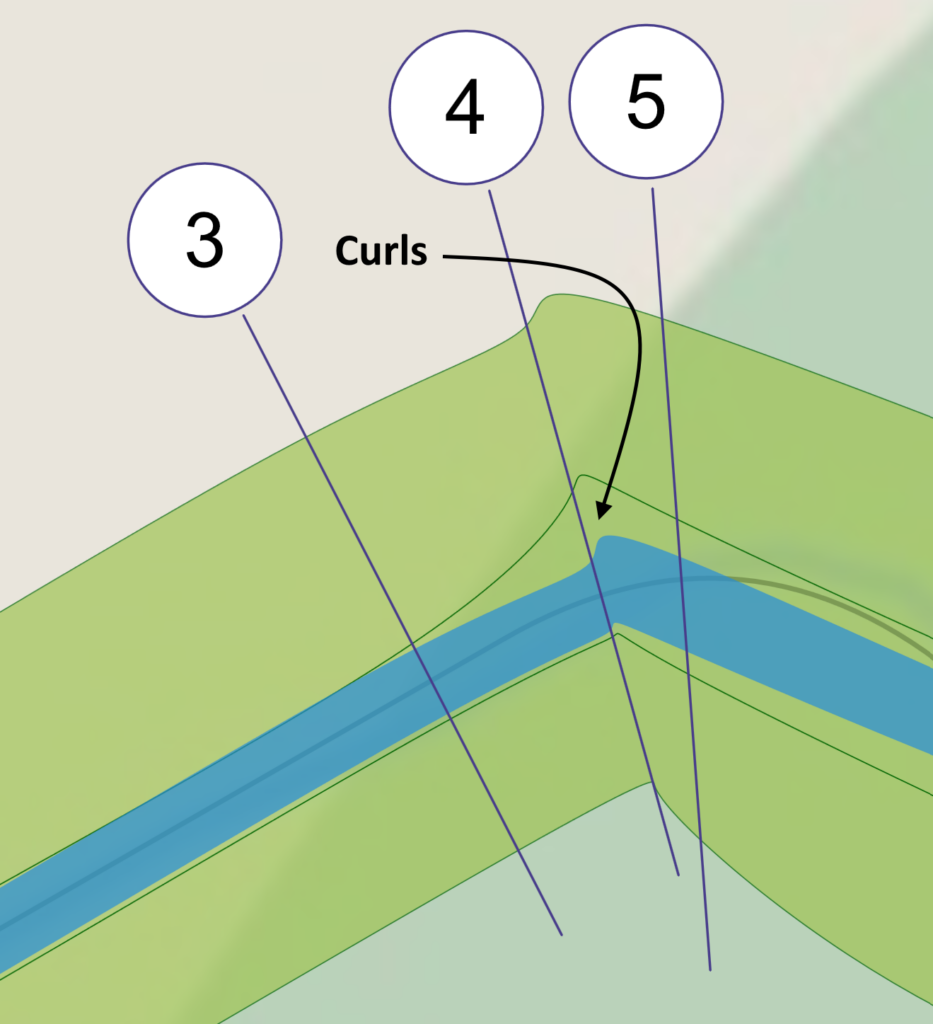
In order to prevent curling, it is imperative to create sufficient spacing between your Sections. The aforementioned illustration demonstrates that Sections 4 and 5 are positioned too closely together, resulting in an inadequate smoothness. To rectify this, relocate Section 5 further upstream. If it is not feasible to adjust the Section Stationing, revert back to utilizing Straight Segments.
Animated Flow Paths
Channel Studio calculates the flow path centroids for each cross section automatically. Separate flow paths, corresponding to the associated centroids, can also be visualized on the Plan view as animated flow path streamlines.
These flow paths provide an excellent visual on how fast and where water flows between Sections. It gives you a clue on the differences in Overbank velocities compared to the Channel as well as the changes in directions upstream and downstream of bridge and Culvert sections.
The Flow Paths button on the side toolbar of the Plan tab can be clicked to activate or deactivate this feature. It is important to remember that these paths are influenced by the Curved vs. Straight function mentioned earlier.

Flow Path Animation Speed and Time Considerations
You might observe variations in the animation speed across Channel, Left Overbank, and Right Overbank. The speeds are determined by the average velocities of the Channel, Right Overbank, and Left Overbank, calculated over the entire Reach that encompasses all Sections.
The time taken for the flow path arrow to move between Sections remains constant and is determined by the average Reach Length divided by the Average velocity.
Time = Ave Reach Length / Average Velocity
In cases where there are inconsistencies in Reach Lengths, you may notice a significant increase or decrease in speed between those irregular Sections. It is advisable to include Sections in your model at consistent Reach Lengths, such as every 100 feet.
A speed ratio of 10 is applied to the animations for visual effect.
Exporting Your Plan Drawing
You can export the Plan view in a variety of formats as mentioned above. To export, click the [Download] button on the side toolbar and choose one of the menu options.

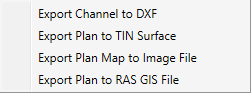
Note that the DXF and TIN Surface export options only include the channel and water surface. Because they are drawn schematically, bridge, culvert and weir structures are omitted. Exporting to a RAS-GIS file is only available after you have computed a water surface.
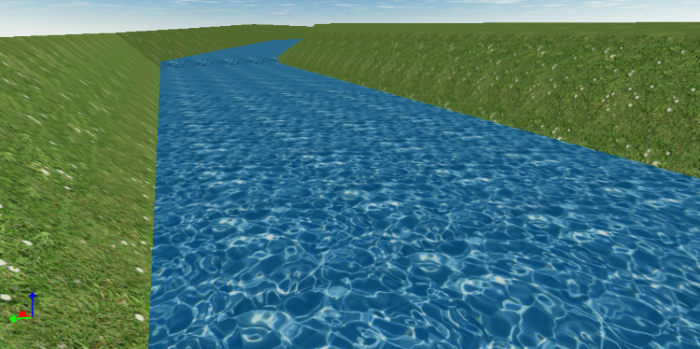
Exporting to a TIN Surface
One option that deserves particular attention is the TIN Surface. Channel Studio can save this image as a LandXML Tin Surface for which you can import into your CAD software which may have enhanced 3-D viewing capabilities. The Channel and Water Surface are saved as individual Surfaces for which you can assign different textures as shown below.
Plan View Troubleshooting
On occasion your plan map may appear to be disfigured or jumbled up. This may be due to the cross-section locations exactly coinciding with the river reach connection points. To remedy, just edit the locations of any suspect cross-sections by a small amount (double-click the section line and drag on the Model tab or edit the Station on the Input Grid).
Getting a Hard Copy
You can instantly export this graph as an image file for insertion into other documents by right-clicking anywhere on the plot and choosing, “Export this Chart…”.
Of course, a more formal presentation is available by clicking on the [Print] button on the top Ribbon Menu, Home tab. See Printing Results for more information.
