This task allows you to model a variety of weir shapes and configurations. It provides plenty of graphs, grid-style numerical outputs, a rating table and formal printed reports.
A weir is basically a notch in a structure of some shape through which water flows. The edge of which water flows over is termed the crest. Weirs with a sharp upstream edge that cause the water to spring clear of the crest are called sharp-crested. Weirs that have a horizontal crest sufficiently long in the direction of flow so that full hydrostatic pressure is developed, even for a short distance, is termed broad-crested.


The following weir shapes are available:
- Rectangular (sharp and broad-crested)
- Triangular
- Trapezoidal and Cipoletti
- V-notch
- Compound (two-stage)
A tailwater condition can be specified for any weir.
Studio Express quickly calculates:
- A rating table of Q vs. Depth based on a range of flow rates
- Depth from a single known Q
- Flow from a user-defined depth

Weir Input Requirements
The input requirements are designed to be minimal but thorough. To enter data, type in the value or select from a drop-down input box, and press [Enter] or the [Tab] key. Following is a description of those required items. Once the data is input, results are computed by clicking the [Compute] button at the bottom of the input grid.
Data is divided into three categories;
- Weir (physical properties)
- Discharge (flows)
- Tailwater (optional)
Following is a description of each. While entering data for the first time, the canvas will automatically display help diagrams to assist in your data entry and the input grid will show only those data items pertaining to the selected weir type.
Weir Name
Optional but it is a recommended input as it is this label that identifies the section on the Weirs List and reports.
Weir Data
Weir Type
Select the type of weir from the drop-down list box or visually select from the Canvas.

Inputs needed depend on the weir type selected. Below is a description of all inputs.
Crest Length
Enter the length of the crest.
Side Slope, (z:1)
Enter the side slope, z horizontal to 1 vertical, for the weir. Enter zero or 0.25 for Cipoletti weirs.
Total Depth
Enter the total depth of this weir as the distance from the crest to the top.
Total Angle (v-notch)
Enter the total angle (from one side to the other) in degrees. Must be between 10 and 120.
Total Crest Length (Compound)
Enter the total length of the crest.
Lower Crest Length (Compound)
Enter the length of short weir crest. Must be less than the Total Crest Length.
Upper Weir Depth (Compound)
Enter the depth of the section of weir on top.
Crest Elevation
Enter the elevation of the crest.
Crest Elevation Up (Compound)
Enter the elevation of the upper crest.
Crest Elevation Dn (Compound)
Enter the elevation of lower crest.
Weir Coefficient (Cw)
Enter the weir coefficient. This will automatically be set to the default coefficient in the Settings. Will be automatically computed for V-notch weirs based on the Total Angle.
Discharge Data
Discharge Method
Select the discharge method from the drop-down list box. You can develop flows by specifying:
- Range of depths with user-defined number of increments
- Known Q
- Known depth
- Set of user-defined flows
Q vs. Depth
For Q vs Depth, enter the number of increments or depth values to be used for the Rating table. The default value is 10. The total cannot exceed 100. For example, if the Total Depth is 2.5 and the Increments = 10, Studio Express will compute Q’s for each 2.5/10 or every 0.25 feet of depth. The Results Grid will populate with 10 rows beginning at 0.25 feet up to 2.5.
Known Flow Rate
Enter a known flow rate and Studio Express will compute a corresponding weir depth.
Known Depth
Enter a known depth and Studio Express will compute a corresponding discharge. This value must be <= Total Depth.
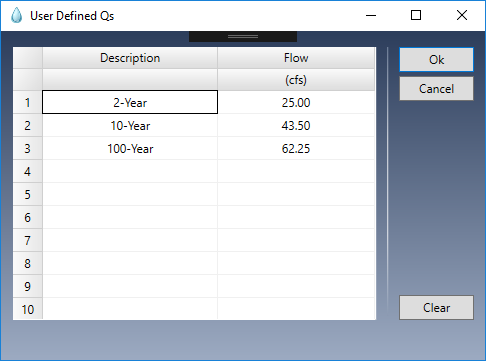
User-Defined Flows
This method allows you to enter a custom set of up to ten unique Q’s. These may, for example, correspond to flows previously determined. Data can also be copied and pasted by right-clicking on the table.
Tailwater
You have the option of specifying a tailwater elevation to model fully or partially submerged weirs.
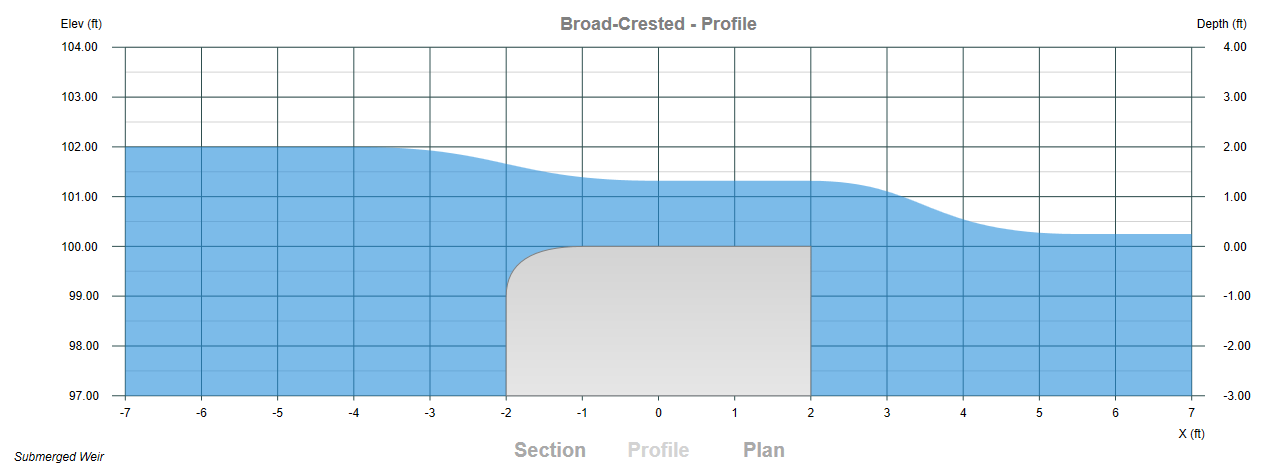
In the weir above, a tailwater elevation of 100.25 was entered which resulted in a fully submerged weir.
Computing Results
Once you entered your data, click the [Compute] button at the bottom of the input grid.
![]()
Studio Express will first do a data check to make sure the inputs are okay. You’ll then be presented with the results.
You can clear the data from the input grid by using the [Clear] button.
Plot Options
![]()
Once the results have been computed, you’ll have a variety of ways to view them. You can plot sections, which include Section, Profile and Plan views, or you can plot a Rating Curve. Sections and Rating Curves are selected using the toggle buttons at the top left of the canvas. To view the different sections, simply click on Section, Profile or Plan at the bottom of the canvas drawing.
Adjusting the Datum
The software arbitrarily sets the Datum (the lowest elevation shown on the Section and Profile graphs). You can modify this elevation using the Datum arrow Up/Down buttons. This will not affect the calculated results, however since Studio Express uses projectile motion concepts for determining the distance the free-flow travels, you will see a change in that distance.
Click the [Refresh] button to return the plot to it’s defaults.