This section describes the most common basic tasks you will use when working with Culvert Studio. Although two separate but related tasks (culverts and channels) are covered in Culvert Studio, it uses only one user interface style. The input, output and reporting procedures are the same throughout.
Below is the opening screen with primary components identified.
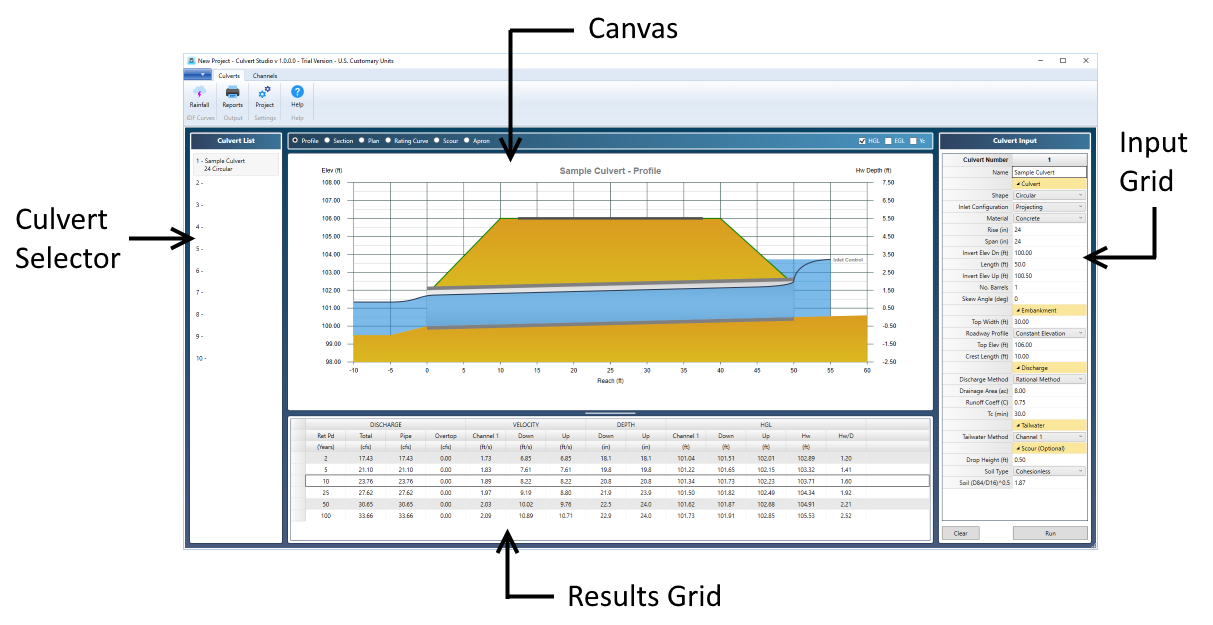
In short, you begin modeling a culvert by first selecting one of the available culverts on the Culvert Selector, “Culvert List” to the left of your screen. Next, enter data for that culvert in the Input Grid, “Culvert Input”, on the right. Then click the [Run] button and view results on the Results Grid at the bottom. Clicking on a particular row in the grid will display those numerical results graphically. Click the Reports button on top to view/print a hard copy of those results.
Starting a New Project
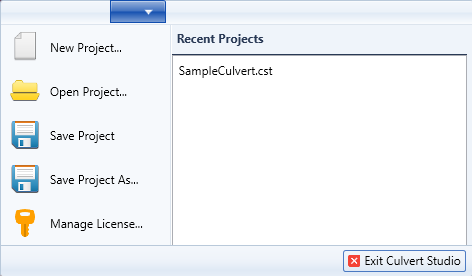
Starting new project with Culvert Studio is as easy as creating a new word processing file – just click on the File menu, select New Project. That’s it. In fact, the program is ready to start a new project upon initial launch. In addition, Culvert Studio reloads the default rainfall files replacing those which may have been used in a previously loaded project.
Culvert Studio’s User Interface
Ribbon Menu
The home screen contains a state-of-the-art Ribbon control as its main menu. The Ribbon menu contains tabs along the top corresponding to Culverts or Channels. The Ribbon menu has virtually eliminated or replaced many of those dialog boxes you’ve seen in legacy software, giving direct access to options without loading other windows and forms first.
You’ll begin by selecting one of the tabs on the Ribbon Toolbar; Culverts or Channels. Culverts is the default upon each start and initializing new projects. Once you have selected your task the standard procedure takes only two steps:
- Enter data in the Input Grid. This grid is located on the right side of your screen and works like most spreadsheets. Just type the value or select from a drop-down list box and press [Enter] or [Tab]. The cursor will advance to the next item. To edit an item, double-click the cell or press [F2].
- Click [Run]. That’s it. Culvert Studio then computes the output, populates the Results Grid and draws the culvert Profile on the canvas.
Clearing the input table is easily accomplished by clicking the [Clear] button.
About the Canvas
Your workspace contains a primary drawing canvas which plots your culvert and channel sections, profiles, etc. It allows you to switch to different drawing types while building and maintaining your model. In other words, you can be using any one of them while modifying the input data. This allows you make changes to inputs and re-compute results, providing instant feedback as the canvas gets updated after each input.
The canvas does two things;
- Draws your culvert in Profile, Section, Plan as well as a Rating Curve.
- Provides help diagrams to assist in your data entry. Once you have established a culvert, the canvas will automatically draw the real thing and update the drawing after each new input.
You can freely change the type of drawing, Profile, Section, Plan, Scour, etc. by selecting the desired radio option at the upper left of the canvas.

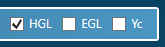
If the calculations are current, you can optionally toggle on or off the HGL (Hydraulic Grade Line), EGL, (Energy Grade Line) and Yc (Critical Depth) line by checking on or off the check boxes in the upper right of the canvas.
In addition to getting formal printed reports, you can quickly save the canvas to a .bmp, .jpg or .png file by right-clicking the canvas and choosing, “Export this chart…”.
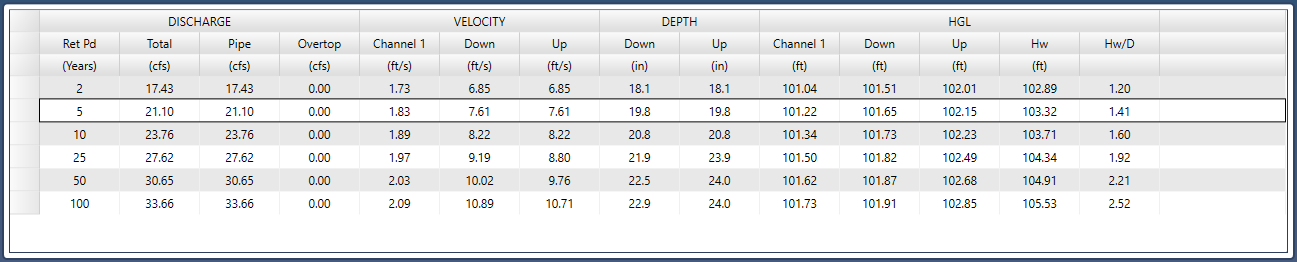
About the Results Grid
The Results Grid contains your numerical output. The column headings may change according to the task as well as certain input parameters. In all cases, the canvas drawing will correspond to the current row selected on the grid. A variety of scenarios can be viewed by selecting any of the grid rows. When printing reports, the output will highlight the select data/grid row.
You can copy this grid to the Windows clipboard or export it to a .csv or txt file by right-clicking on the grid. This feature may be useful for creating custom reports in a spreadsheet, word processor or cad drawing outside of Culvert Studio’s reporting features.
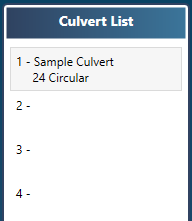
Using the Culvert/Channel List
Culvert Studio allows you to build and model up to 10 unique Culverts or Channels in each project. The selector list located on the left of your screen provides quick and easy access to any of them. Each row on the list represents a single culvert or channel.
You can clear, copy or paste culverts and channels by right-clicking on them and selecting the desired task on the context menu.